Pattern Trade Levels
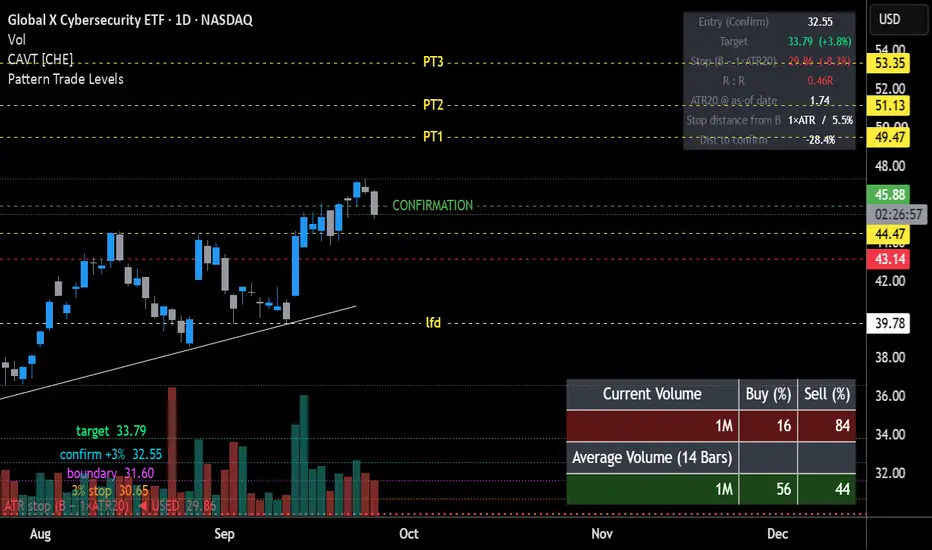
Pattern Trade Levels
Plots the key levels for a chart-pattern breakout from two inputs: the breakout boundary and the pattern low. Enter them and the script draws the confirmation level, the measured-move target and your stop, plus a small R:R table in the corner. Use it to check whether a setup is worth taking before the breakout triggers.
What it draws
- Boundary: the resistance line you drew.
- Confirm: the boundary plus a buffer (3% by default, the Edwards & Magee rule). A daily close above it confirms the breakout.
- Target: the measured move, either log (B × B / L) or linear (B + (B − L)).
- Stops. Three options, and the one in use is drawn thicker and marked "USED":
- ATR (the default): boundary − k × ATR20. ATR20 is a simple 20-bar average of true range. It's frozen on the date you set, so the stop doesn't drift each day.
- Percent: boundary − 3%.
- Structural: any level you type in, such as the low of the last full day inside the pattern.
The table
Entry, target (% away), stop (% away), R:R (green at 2R or better), the ATR20 used, the stop's distance from the boundary in ATRs and %, and how far price is from the confirmation level.
Alerts
- Confirm breakout: a close crosses above the confirmation level.
- Boundary touch: price crosses above the boundary.
- Stop touched: price trades below the selected stop.
How to use it
1. Draw your pattern and read off the boundary (B) and the pattern low (L).
2. Set the ATR as-of date to your breakout or entry day.
3. Pick an entry basis for the R:R (the confirmation level, the boundary, or the current price) and check that the trade clears your minimum R:R.
4. Size from the stop, e.g. shares = dollar risk ÷ (entry − stop).
Notes
- The stop is a starting point, not a recommendation. Stops about 0.75 to 1.25 ATR below the boundary performed about the same in my own testing. Choose one that suits the instrument.
- Levels assume a horizontal boundary. For sloped patterns, enter the level where the breakout actually happens.
- This is an indicator, not a strategy. It doesn't take trades or backtest anything.
- For education only. Not financial advice.
Plots the key levels for a chart-pattern breakout from two inputs: the breakout boundary and the pattern low. Enter them and the script draws the confirmation level, the measured-move target and your stop, plus a small R:R table in the corner. Use it to check whether a setup is worth taking before the breakout triggers.
What it draws
- Boundary: the resistance line you drew.
- Confirm: the boundary plus a buffer (3% by default, the Edwards & Magee rule). A daily close above it confirms the breakout.
- Target: the measured move, either log (B × B / L) or linear (B + (B − L)).
- Stops. Three options, and the one in use is drawn thicker and marked "USED":
- ATR (the default): boundary − k × ATR20. ATR20 is a simple 20-bar average of true range. It's frozen on the date you set, so the stop doesn't drift each day.
- Percent: boundary − 3%.
- Structural: any level you type in, such as the low of the last full day inside the pattern.
The table
Entry, target (% away), stop (% away), R:R (green at 2R or better), the ATR20 used, the stop's distance from the boundary in ATRs and %, and how far price is from the confirmation level.
Alerts
- Confirm breakout: a close crosses above the confirmation level.
- Boundary touch: price crosses above the boundary.
- Stop touched: price trades below the selected stop.
How to use it
1. Draw your pattern and read off the boundary (B) and the pattern low (L).
2. Set the ATR as-of date to your breakout or entry day.
3. Pick an entry basis for the R:R (the confirmation level, the boundary, or the current price) and check that the trade clears your minimum R:R.
4. Size from the stop, e.g. shares = dollar risk ÷ (entry − stop).
Notes
- The stop is a starting point, not a recommendation. Stops about 0.75 to 1.25 ATR below the boundary performed about the same in my own testing. Choose one that suits the instrument.
- Levels assume a horizontal boundary. For sloped patterns, enter the level where the breakout actually happens.
- This is an indicator, not a strategy. It doesn't take trades or backtest anything.
- For education only. Not financial advice.

免责声明
这些信息和出版物并非旨在提供,也不构成TradingView提供或认可的任何形式的财务、投资、交易或其他类型的建议或推荐。请阅读使用条款了解更多信息。