OPEN-SOURCE SCRIPT
Hidden Markov Model Market Regimes [LuxAlgo]
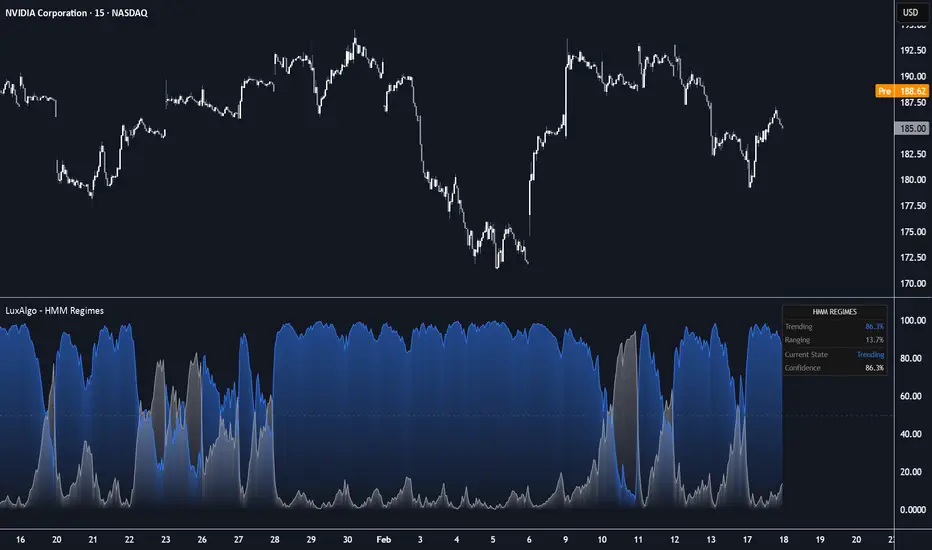
The Hidden Markov Model Market Regimes indicator uses a mathematical framework to identify whether the current market environment is in a Trending or Ranging state. By analyzing log returns and volatility through a Hidden Markov Model (HMM) approach, the tool provides real-time probability estimates for each regime to help traders adapt their strategies to changing market conditions.
🔶 USAGE
The indicator is displayed in a separate pane below the price chart, showing two oscillating lines representing the probability (0% to 100%) of the market being in a "Trending" or "Ranging" regime.
Traders can use these regimes to filter signals: trend-following strategies (like moving average crosses) typically perform better when the Trending probability is high, while mean-reversion strategies (like oscillators) are often more effective during high Ranging probability periods.
🔶 DETAILS
The script implements a simplified version of the HMM Forward Algorithm to estimate "hidden" market states from observable price data.
🔹 Observation Data
The model processes two main inputs:
🔹 The Forward Algorithm
The indicator calculates "Emission Likelihoods" based on Gaussian heuristics. It assumes that a Ranging state is characterized by low volatility and returns near zero, while a Trending state is characterized by higher volatility and significant price displacement.
The algorithm then combines these likelihoods with the "Transition Matrix" (which assumes regimes tend to persist over time) to calculate the posterior probability of each state. The Learning Rate setting determines how much weight is given to the newest bar's data versus the previous state's probability.
🔶 SETTINGS
🔹 HMM Settings
🔹 Dashboard
🔶 USAGE
The indicator is displayed in a separate pane below the price chart, showing two oscillating lines representing the probability (0% to 100%) of the market being in a "Trending" or "Ranging" regime.
- Trending Regime (Blue): High values indicate a directional market with expanding volatility and persistent returns.
- Ranging Regime (Gray): High values indicate a mean-reverting environment with lower volatility and compressed price action.
- Neutral Zone: When both lines are near the 50% level, the model is uncertain about the current regime, suggesting a potential transition.
Traders can use these regimes to filter signals: trend-following strategies (like moving average crosses) typically perform better when the Trending probability is high, while mean-reversion strategies (like oscillators) are often more effective during high Ranging probability periods.
🔶 DETAILS
The script implements a simplified version of the HMM Forward Algorithm to estimate "hidden" market states from observable price data.
🔹 Observation Data
The model processes two main inputs:
- Log Returns: Used to detect directional movement and momentum.
- Volatility: Calculated via standard deviation to differentiate between high-activity trends and low-activity ranges.
🔹 The Forward Algorithm
The indicator calculates "Emission Likelihoods" based on Gaussian heuristics. It assumes that a Ranging state is characterized by low volatility and returns near zero, while a Trending state is characterized by higher volatility and significant price displacement.
The algorithm then combines these likelihoods with the "Transition Matrix" (which assumes regimes tend to persist over time) to calculate the posterior probability of each state. The Learning Rate setting determines how much weight is given to the newest bar's data versus the previous state's probability.
🔶 SETTINGS
🔹 HMM Settings
- Lookback Period: Determines the window used to calculate mean returns and volatility benchmarks. A longer lookback provides more stable regime detection, while a shorter lookback is more reactive.
- Learning Rate: Controls the sensitivity of the probability updates. A higher value makes the indicator switch between regimes faster, while a lower value filters out market noise.
🔹 Dashboard
- Enable Dashboard: Toggles the visibility of the on-screen information table.
- Position: Moves the dashboard to different corners of the chart (Top Right, Bottom Right, or Bottom Left).
- Size: Adjusts the scale of the dashboard text and cells.
开源脚本
秉承TradingView的精神,该脚本的作者将其开源,以便交易者可以查看和验证其功能。向作者致敬!您可以免费使用该脚本,但请记住,重新发布代码须遵守我们的网站规则。

Build your own edge with AI: luxalgo.com
All content provided by LuxAlgo is for informational & educational purposes only. Past performance does not guarantee future results.
All content provided by LuxAlgo is for informational & educational purposes only. Past performance does not guarantee future results.
免责声明
这些信息和出版物并非旨在提供,也不构成TradingView提供或认可的任何形式的财务、投资、交易或其他类型的建议或推荐。请阅读使用条款了解更多信息。
开源脚本
秉承TradingView的精神,该脚本的作者将其开源,以便交易者可以查看和验证其功能。向作者致敬!您可以免费使用该脚本,但请记住,重新发布代码须遵守我们的网站规则。
Build your own edge with AI: luxalgo.com
All content provided by LuxAlgo is for informational & educational purposes only. Past performance does not guarantee future results.
All content provided by LuxAlgo is for informational & educational purposes only. Past performance does not guarantee future results.
免责声明
这些信息和出版物并非旨在提供,也不构成TradingView提供或认可的任何形式的财务、投资、交易或其他类型的建议或推荐。请阅读使用条款了解更多信息。