ABW Multi-Timeframe FVG
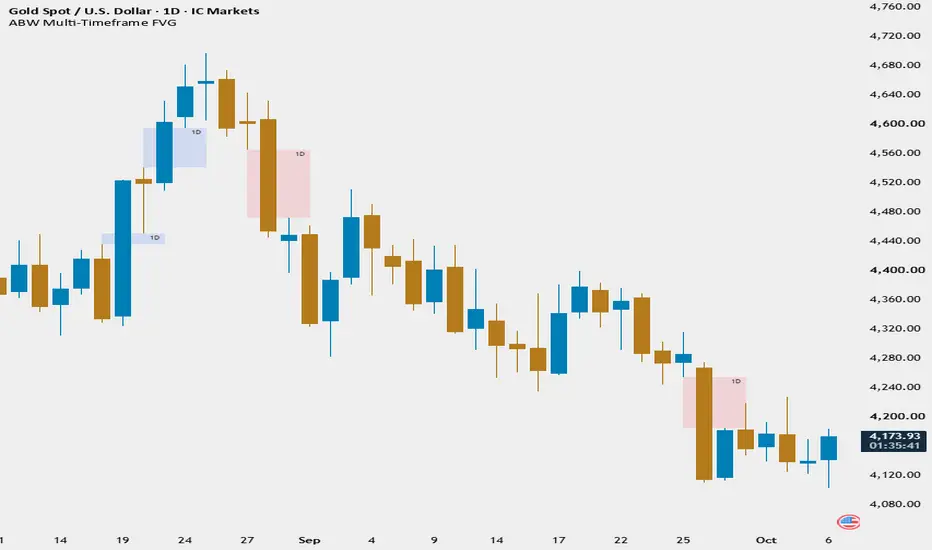
ABW Multi-Timeframe FVG
Overview
ABW Multi-Timeframe FVG displays confirmed fair value gaps from your chart timeframe and one higher timeframe in a single overlay. Its focus is clear formation windows: every box stays within the source candles that created the gap. In the default recent mode, separate retention limits keep higher-timeframe formations visible as new chart-timeframe gaps appear.
Bullish gaps use blue fill; bearish gaps use red fill. Boxes have no outlines. Small, regular labels at the top-right identify the source timeframe, and fill transparency is adjustable.
The script is open-source, so you can inspect how the gap rules, confirmation, timeframe selection, and retention are implemented.

Daily-chart example: 1D labels mark daily formations; M labels mark monthly formations.
How a Gap Is Defined
The indicator examines three consecutive candles on each source timeframe.
Equal wick prices do not qualify. Candle 2 has no color or body-size requirement. There are no additional displacement, volume, trend, or minimum-gap filters.
Confirmation and Fixed Boxes
Chart-timeframe gaps appear only after candle 3 closes. Higher-timeframe gaps use confirmed source candles and become available on the first chart update of the next higher-timeframe period. A session break can delay that update.
Each box begins at source candle 1's opening time and ends exactly at source candle 3's closing time, including when the source is displayed on a lower-timeframe chart. Higher-timeframe boxes are drawn back over that earlier formation window after confirmation; they were not available while the source candle was still developing.
Boxes never extend forward or shrink after creation. A later price touch or fill does not remove them. The script records formation and does not track mitigation status; older boxes are removed only when the selected retention limit requires it.
Automatic Higher-Timeframe Mapping
Chart timeframe -> Higher timeframe
One higher-timeframe layer is displayed at a time. A manual override can replace this mapping with any supported time-based timeframe strictly higher than the chart timeframe. Equal or lower selections are rejected. For chart intervals outside the automatic map, a status message asks you to choose a manual higher timeframe or disable that layer.
Settings Guide

Controls 1-9: visibility, appearance, and recent limits. Default quotas: chart 5 bullish + 5 bearish; higher timeframe 3 + 3.
Visibility
Appearance
FVG Retention
The default allows up to 16 boxes, subject to available gaps. Each group accepts 0-125; setting a group to 0 hides that group. Chart groups cannot remove higher-timeframe boxes, and higher-timeframe groups cannot remove chart boxes. Recency is ranked by source candle 3's closing time, not delivery order, so an older delayed gap cannot replace newer gaps within its group.

Controls 10-12: the combined historical cap and manual override. The manual source interval must be strictly higher than the chart.
Higher Timeframe
Interpretation and Limitations
Use standard time-based charts. Heikin Ashi, Renko, Range, other synthetic charts, and tick charts are unsupported. The display depends on available chart history, confirmed source data, enabled layers, and retention limits.
Blue and red describe the gap's formation direction. A displayed formation does not predict a price reaction or establish a trade signal. The indicator provides no entry/exit signals, alerts, or performance guarantees.
Overview
ABW Multi-Timeframe FVG displays confirmed fair value gaps from your chart timeframe and one higher timeframe in a single overlay. Its focus is clear formation windows: every box stays within the source candles that created the gap. In the default recent mode, separate retention limits keep higher-timeframe formations visible as new chart-timeframe gaps appear.
Bullish gaps use blue fill; bearish gaps use red fill. Boxes have no outlines. Small, regular labels at the top-right identify the source timeframe, and fill transparency is adjustable.
The script is open-source, so you can inspect how the gap rules, confirmation, timeframe selection, and retention are implemented.
Daily-chart example: 1D labels mark daily formations; M labels mark monthly formations.
How a Gap Is Defined
The indicator examines three consecutive candles on each source timeframe.
- Bullish FVG: candle 3's low is strictly above candle 1's high. The box spans the price interval between those two wick prices.
- Bearish FVG: candle 3's high is strictly below candle 1's low. The box spans the price interval between those two wick prices.
Equal wick prices do not qualify. Candle 2 has no color or body-size requirement. There are no additional displacement, volume, trend, or minimum-gap filters.
Confirmation and Fixed Boxes
Chart-timeframe gaps appear only after candle 3 closes. Higher-timeframe gaps use confirmed source candles and become available on the first chart update of the next higher-timeframe period. A session break can delay that update.
Each box begins at source candle 1's opening time and ends exactly at source candle 3's closing time, including when the source is displayed on a lower-timeframe chart. Higher-timeframe boxes are drawn back over that earlier formation window after confirmation; they were not available while the source candle was still developing.
Boxes never extend forward or shrink after creation. A later price touch or fill does not remove them. The script records formation and does not track mitigation status; older boxes are removed only when the selected retention limit requires it.
Automatic Higher-Timeframe Mapping
Chart timeframe -> Higher timeframe
- 1 minute -> 15 minutes
- 3 minutes -> 30 minutes
- 5 minutes -> 1 hour
- 15 minutes -> 4 hours
- 1 hour -> 1 day
- 4 hours -> 1 week
- 1 day -> 1 month
One higher-timeframe layer is displayed at a time. A manual override can replace this mapping with any supported time-based timeframe strictly higher than the chart timeframe. Equal or lower selections are rejected. For chart intervals outside the automatic map, a status message asks you to choose a manual higher timeframe or disable that layer.
Settings Guide
Controls 1-9: visibility, appearance, and recent limits. Default quotas: chart 5 bullish + 5 bearish; higher timeframe 3 + 3.
Visibility
- 1. Show chart timeframe FVGs: enables local formations or hides them when focusing on higher-timeframe context. Default: on.
- 2. Show higher timeframe FVGs: enables the mapped or manually selected higher-timeframe layer. Default: on.
Appearance
- 3. Show source timeframe labels: identifies the source of each gap or hides text to reduce clutter. Default: on. 5M and 15M denote minutes; 1H and 4H hours; 1D daily; W weekly; M monthly.
- 4. Fill transparency: 0 is opaque and 100 is fully transparent. Default: 85. Labels are controlled separately from fill transparency.
FVG Retention
- 5. Show recent FVGs only: keeps the view focused on recent formations. Default: on. Limits apply separately to all four groups below.
- 6. Chart: bullish FVG limit: default 5.
- 7. Chart: bearish FVG limit: default 5.
- 8. Higher timeframe: bullish FVG limit: default 3.
- 9. Higher timeframe: bearish FVG limit: default 3.
The default allows up to 16 boxes, subject to available gaps. Each group accepts 0-125; setting a group to 0 hides that group. Chart groups cannot remove higher-timeframe boxes, and higher-timeframe groups cannot remove chart boxes. Recency is ranked by source candle 3's closing time, not delivery order, so an older delayed gap cannot replace newer gaps within its group.
Controls 10-12: the combined historical cap and manual override. The manual source interval must be strictly higher than the chart.
- 10. Historical mode: total FVG limit: active only when recent-only mode is off. It replaces the four recent quotas with one combined limit across both layers and directions. Range: 1-500; default: 500. The oldest source formation is removed first.
Higher Timeframe
- 11. Use a manual higher timeframe: default off, so the automatic map is used.
- 12. Manual higher timeframe: default 1 hour. It takes effect when manual override and the higher-timeframe layer are enabled; choose a value strictly higher than your chart.
Interpretation and Limitations
Use standard time-based charts. Heikin Ashi, Renko, Range, other synthetic charts, and tick charts are unsupported. The display depends on available chart history, confirmed source data, enabled layers, and retention limits.
Blue and red describe the gap's formation direction. A displayed formation does not predict a price reaction or establish a trade signal. The indicator provides no entry/exit signals, alerts, or performance guarantees.

ABW: asifbrainwaves.com/ | Facebook Page: facebook.com/profile.php?id=61591363734555 | LinkedIn: linkedin.com/in/muhammad-asif-392a50263/
免责声明
这些信息和出版物并非旨在提供,也不构成TradingView提供或认可的任何形式的财务、投资、交易或其他类型的建议或推荐。请阅读使用条款了解更多信息。
ABW: asifbrainwaves.com/ | Facebook Page: facebook.com/profile.php?id=61591363734555 | LinkedIn: linkedin.com/in/muhammad-asif-392a50263/
免责声明
这些信息和出版物并非旨在提供,也不构成TradingView提供或认可的任何形式的财务、投资、交易或其他类型的建议或推荐。请阅读使用条款了解更多信息。