OPEN-SOURCE SCRIPT
MTF Candle Status Dashboard: Real-Time Volume & Momentum
Description
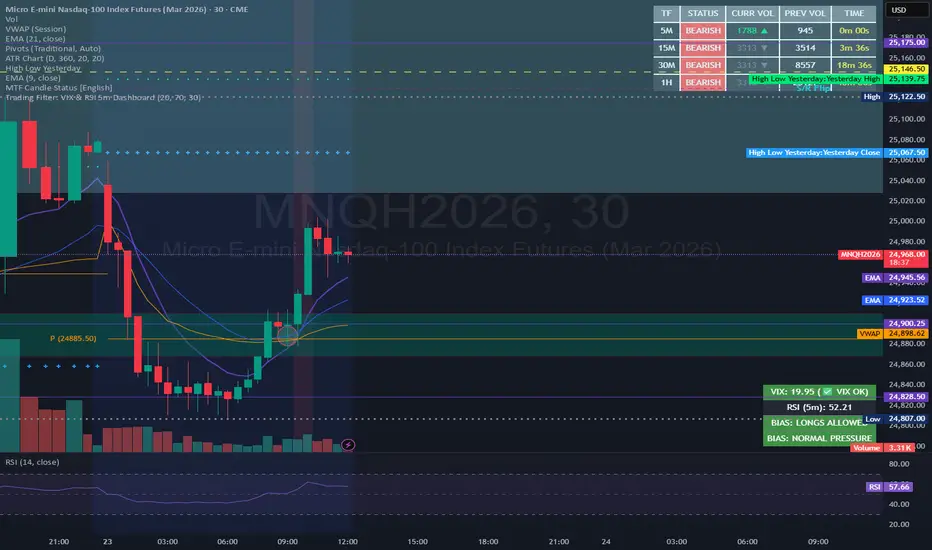
This high-contrast dashboard provides a comprehensive view of market momentum across multiple timeframes (5m, 15m, 30m, and 1h) directly on your main chart. It is specifically designed for day traders who need to monitor price sentiment and volume breakouts simultaneously without switching tabs.
Key Features:
Multi-Timeframe Analysis: Real-time monitoring of the 5-minute, 15-minute, 30-minute, and 1-hour candles.
Live Sentiment Tracking: Instantly see if the current price action is Bullish or Bearish across all periods.
Smart Volume Breakout Indicator: Compares the Current Volume of the live candle against the Previous Candle's Volume.
▲ (Lime Green): Current volume has already exceeded the previous candle's total volume (High Momentum).
▼ (Gray): Current volume is still lower than the previous candle.
Integrated Countdown Timer: A precision timer for each timeframe showing exactly how much time remains before the current candle closes.
High-Contrast UI: Optimized for both dark and light themes with a black background and bold colors to ensure readability over complex indicators or price action.
How to use it:
Confluence: Look for moments where all timeframes turn the same color (e.g., all Green). This indicates strong trend alignment.
Volume Confirmation: When you see a BULLISH status combined with the ▲ symbol in the Volume column, it confirms a high-conviction move supported by increasing market participation.
Timing: Use the TIME column to prepare for entries just before a candle closes or to avoid "fakes" during low-volume periods.
This high-contrast dashboard provides a comprehensive view of market momentum across multiple timeframes (5m, 15m, 30m, and 1h) directly on your main chart. It is specifically designed for day traders who need to monitor price sentiment and volume breakouts simultaneously without switching tabs.
Key Features:
Multi-Timeframe Analysis: Real-time monitoring of the 5-minute, 15-minute, 30-minute, and 1-hour candles.
Live Sentiment Tracking: Instantly see if the current price action is Bullish or Bearish across all periods.
Smart Volume Breakout Indicator: Compares the Current Volume of the live candle against the Previous Candle's Volume.
▲ (Lime Green): Current volume has already exceeded the previous candle's total volume (High Momentum).
▼ (Gray): Current volume is still lower than the previous candle.
Integrated Countdown Timer: A precision timer for each timeframe showing exactly how much time remains before the current candle closes.
High-Contrast UI: Optimized for both dark and light themes with a black background and bold colors to ensure readability over complex indicators or price action.
How to use it:
Confluence: Look for moments where all timeframes turn the same color (e.g., all Green). This indicates strong trend alignment.
Volume Confirmation: When you see a BULLISH status combined with the ▲ symbol in the Volume column, it confirms a high-conviction move supported by increasing market participation.
Timing: Use the TIME column to prepare for entries just before a candle closes or to avoid "fakes" during low-volume periods.
开源脚本
秉承TradingView的精神,该脚本的作者将其开源,以便交易者可以查看和验证其功能。向作者致敬!您可以免费使用该脚本,但请记住,重新发布代码须遵守我们的网站规则。

免责声明
这些信息和出版物并非旨在提供,也不构成TradingView提供或认可的任何形式的财务、投资、交易或其他类型的建议或推荐。请阅读使用条款了解更多信息。
开源脚本
秉承TradingView的精神,该脚本的作者将其开源,以便交易者可以查看和验证其功能。向作者致敬!您可以免费使用该脚本,但请记住,重新发布代码须遵守我们的网站规则。
免责声明
这些信息和出版物并非旨在提供,也不构成TradingView提供或认可的任何形式的财务、投资、交易或其他类型的建议或推荐。请阅读使用条款了解更多信息。