OPEN-SOURCE SCRIPT
Thermal Candlestick Spectrogram [Jamallo]
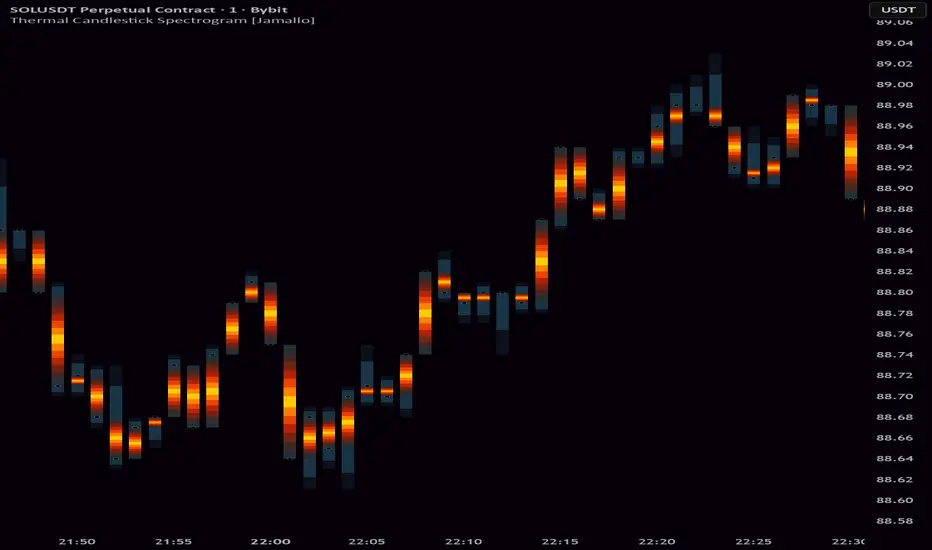
The Thermal Candlestick Spectrogram replaces flat, binary candlesticks with a heat-mapped view of price density. Every bar radiates outward from a white-hot core through layers of orange, red, and deep amber — the same way thermal imaging reveals intensity beneath a surface. The result is a chart that doesn't just show you what price did, it shows you how concentrated that move was.
How It Works
A 7-layer gradient stack is anchored to each candle's midpoint and expands symmetrically toward the edges of the body. Transparency increases with each outer layer, creating a natural falloff that mimics heat dissipation:
White-yellow core — maximum density at the center of the body
Orange-red mantle — transitional layers that reveal the spread of price action
Dark outer boundary — a near-transparent edge that lets candles breathe without hard lines
Fading wicks — a dual-layer vertical fade that tapers wicks naturally toward the High and Low extremes, reducing visual noise
Anti-aliased price dot — a precision close marker with a subtle white halo for clean real-time tracking
Design & Performance
The entire effect runs on a fixed 9-plot architecture (7 body layers + 2 wick layers), keeping script weight low and render performance stable even alongside other indicators. No dynamic loops, no repainting — just a clean, deterministic stack that works across all timeframes and instruments.
Visual Comparison

Traditional flat candles vs. the Thermal Spectrogram — same data, entirely different depth.
How It Works
A 7-layer gradient stack is anchored to each candle's midpoint and expands symmetrically toward the edges of the body. Transparency increases with each outer layer, creating a natural falloff that mimics heat dissipation:
White-yellow core — maximum density at the center of the body
Orange-red mantle — transitional layers that reveal the spread of price action
Dark outer boundary — a near-transparent edge that lets candles breathe without hard lines
Fading wicks — a dual-layer vertical fade that tapers wicks naturally toward the High and Low extremes, reducing visual noise
Anti-aliased price dot — a precision close marker with a subtle white halo for clean real-time tracking
Design & Performance
The entire effect runs on a fixed 9-plot architecture (7 body layers + 2 wick layers), keeping script weight low and render performance stable even alongside other indicators. No dynamic loops, no repainting — just a clean, deterministic stack that works across all timeframes and instruments.
Visual Comparison
Traditional flat candles vs. the Thermal Spectrogram — same data, entirely different depth.
开源脚本
秉承TradingView的精神,该脚本的作者将其开源,以便交易者可以查看和验证其功能。向作者致敬!您可以免费使用该脚本,但请记住,重新发布代码须遵守我们的网站规则。

Join the Growing (Econophysics Trading) Community! ⚛️
discord.com/invite/qb4RKFdwYJ
Trade the physics of price.
discord.com/invite/qb4RKFdwYJ
Trade the physics of price.
免责声明
这些信息和出版物并非旨在提供,也不构成TradingView提供或认可的任何形式的财务、投资、交易或其他类型的建议或推荐。请阅读使用条款了解更多信息。
开源脚本
秉承TradingView的精神,该脚本的作者将其开源,以便交易者可以查看和验证其功能。向作者致敬!您可以免费使用该脚本,但请记住,重新发布代码须遵守我们的网站规则。
Join the Growing (Econophysics Trading) Community! ⚛️
discord.com/invite/qb4RKFdwYJ
Trade the physics of price.
discord.com/invite/qb4RKFdwYJ
Trade the physics of price.
免责声明
这些信息和出版物并非旨在提供,也不构成TradingView提供或认可的任何形式的财务、投资、交易或其他类型的建议或推荐。请阅读使用条款了解更多信息。