OPEN-SOURCE SCRIPT
已更新 Wyckoff Elite - Multi Structure par GUIROA Stephane
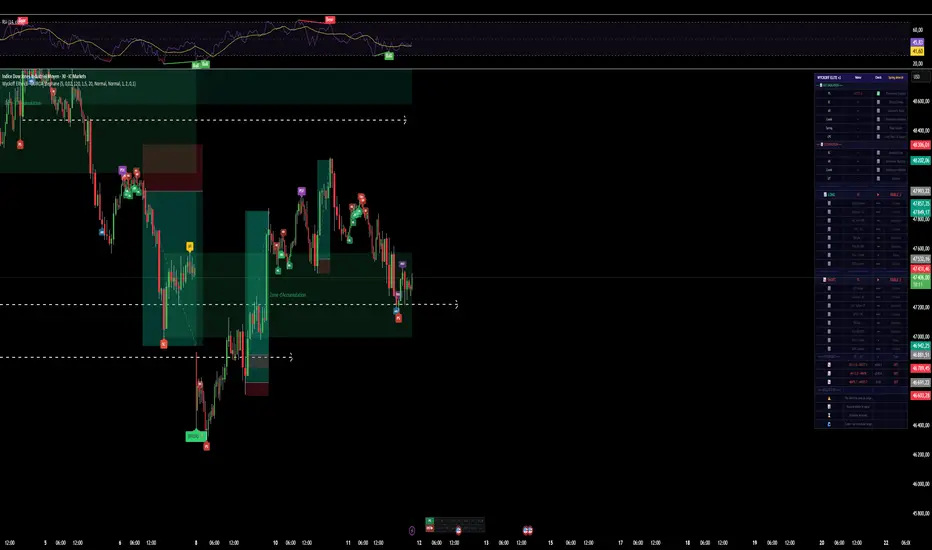
The indicator aims to identify the chronological stages of an accumulation:
PS (Preliminary Support): The first point where significant buying begins to slow the price decline.
SC (Selling Climax): The peak of panic selling, often marking the major low.
AR (Automatic Rally): A rapid technical correction triggered by short covering.
ST (Secondary Test): The price returns to test the SC zone to verify if supply has decreased.
SPRING: A temporary break below the support level (SC) to trap the last sellers before the reversal.
LPS (Last Point of Support): A low higher than the SC, signaling that buyers are now in control.
SOS (Sign of Strength): The price breaks above the AR resistance, confirming the exit from the accumulation zone.
Shutterstock
Explorer
⚙️ Technical Functioning
Pivot Accuracy: The indicator uses a depth parameter to filter noise. The higher this number, the more significant the detected points (but with a greater delay).
Secondary Test Tolerance: For the Secondary Test to be validated, the price must return to a distance close to the Support Level (configurable via the tolerance).
Duration Management: If a structure takes too long to form (maxBars), the indicator automatically resets to avoid drawing outdated patterns.
Dynamic Visualization: Horizontal dashed lines are drawn on the Support Level and the Resistance Level to visualize the Trading Range (the area of sideways movement).
PS (Preliminary Support): The first point where significant buying begins to slow the price decline.
SC (Selling Climax): The peak of panic selling, often marking the major low.
AR (Automatic Rally): A rapid technical correction triggered by short covering.
ST (Secondary Test): The price returns to test the SC zone to verify if supply has decreased.
SPRING: A temporary break below the support level (SC) to trap the last sellers before the reversal.
LPS (Last Point of Support): A low higher than the SC, signaling that buyers are now in control.
SOS (Sign of Strength): The price breaks above the AR resistance, confirming the exit from the accumulation zone.
Shutterstock
Explorer
⚙️ Technical Functioning
Pivot Accuracy: The indicator uses a depth parameter to filter noise. The higher this number, the more significant the detected points (but with a greater delay).
Secondary Test Tolerance: For the Secondary Test to be validated, the price must return to a distance close to the Support Level (configurable via the tolerance).
Duration Management: If a structure takes too long to form (maxBars), the indicator automatically resets to avoid drawing outdated patterns.
Dynamic Visualization: Horizontal dashed lines are drawn on the Support Level and the Resistance Level to visualize the Trading Range (the area of sideways movement).
版本注释
📊 Wyckoff Elite v3 – OverviewThis indicator is an advanced technical analysis tool that automates the detection of Wyckoff cycles (Accumulation, Distribution, Re-Accumulation) on any financial asset (stocks, crypto, forex, etc.). It combines Richard Wyckoff's theory with volume filters (VSA) and a scoring system to provide objective entry/exit signals.
🎯 Main Objective
The indicator aims to:
Automatically identify accumulation phases (buying by large traders) and distribution phases (selling)
Detect key inflection points (Spring, LPS, UT, LPSY, etc.)
Provide a confidence score (0-100%) to validate the signal's quality
Generate alerts and automatic Take Profit/Stop Loss levels
Display a comprehensive dashboard with all real-time information
🔍 Detailed Features
1. Wyckoff Structure Detection
Phase Events Detected Meaning
Accumulation PS → SC → AR → ST → SPRING → LPS → SOS Preparation for an upward move
Distribution PSY → BC → AR → UT → LPSY → SOW Preparation for a move Bearish
Re-Accumulation SC2 → AR2 → LPS2 → SOS2 Bullish pause in a trend
2. Advanced Filters
Volume Filter: Validation of signals with volume spikes (configurable)
VSA (Volume Spread Analysis): Detection of:
NS (No Supply) – Absence of sellers
ND (No Demand) – Absence of buyers
ABS (Absorption) – Strong hands absorbing supply
DIST (Hidden Distribution) – Discreet selling
3. Scoring System (Checklist)
LONG Score based on 9 criteria (Spring, Volume, LPS, RSI, VSA, Creek, SOS...)
SHORT Score based on 9 criteria (UT, Volume, LPSY, RSI, VSA, Creek, SOW...)
Thresholds: <45% (low), 45-74% (medium) ≥75% (Strong Signal)
4. Visual Elements
✅ Colored Range Boxes (Accumulation in Green, Distribution in Red)
✅ Support/Resistance Lines and Creek (Range Median)
✅ Automatic Entry Arrows when Score ≥75%
✅ Explanatory Labels (PS, SC, SPRING, etc.)
✅ Progress Bar at the Bottom to Track Phase Progress
✅ Background Colored According to the Active Phase
5. Risk Management
Automatic Calculation of:
TP1 (Take Profit 1): +100% of the Range Amount
TP2: +200% of the Amount
SL (Stop Loss): -30% of the Amount
Horizontal Lines Displayed After an SOS or SOW
6. Interactive Dashboard (Top Right)
Displays in Real Time:
PS, SC, AR Levels, Creek, LPS (for LONG)
BC, AR, Creek, UT, LPSY (for SHORT) levels
Scores and their interpretation
History of the last 3 patterns
The golden rules of Wyckoff trading
7. Customizable alerts
Spring detected
SOS (Sign of Strength)
Upthrust detected
SOW (Sign of Weakness)
LONG entry (score ≥75%)
SHORT entry (score ≥75%)
⚙️ Key parameters
Group Parameter Role
Plot Accuracy Pivots (5) Sensitivity for detecting highs/lows
ST/UT tolerance (0.02) Margin for Spring/Upthrust
Max duration (120) Timeout for resetting a phase
Volume Volume multiplier (1.5x) High volume threshold
VSA period (20) Moving average of Volume/Spread
Visual Boxes, Background, Checklist Activation of graphic elements
Text size Display adjustment
TP/SL TP1 (1.0x), TP2 (2.0x), SL (0.3x) Ratios relative to range
🧠 Underlying trading logic
The indicator follows the Wyckoff philosophy:
Accumulation phase: Large traders buy discreetly
PS → First support
SC → Selling climax (maximum volume)
AR → Technical rebound
ST → Support test
SPRING → Bearish trap (false breakout)
LPS → Last support point before breakout
SOS → Strength signal (entry)
Distribution phase: Large traders sell
PSY → First resistance
BC → Buying climax
AR → Technical Reaction
UT → Bullish Trap (False Breakout)
LPSY → Last Resistance Point Before Breakout
SOW → Weakness Signal (Entry)
💡 Practical Use
🔴 For a LONG trade
Wait for a SPRING (green label)
Check the LONG score (≥75% in the dashboard)
Enter on LPS or at the green arrow
Place SL below the SC, TP on the calculated lines
🔵 For a SHORT trade
Wait for a UT (red label)
Check the SHORT score (≥75%)
Enter on LPSY or at the red arrow
Place SL above the BC
📌 Tips
Do not trade within the range (between SC and AR)
Wait for a retest after a breakout
Prioritize signals with high volume
Use the dashboard to confirm The convergence of criteria
✅ Advantages
Complete automation of Wyckoff theory
Objectivity through scoring
Adaptable to all timeframes
Clear and intuitive interface
Alerts to ensure you don't miss anything
开源脚本
秉承TradingView的精神,该脚本的作者将其开源,以便交易者可以查看和验证其功能。向作者致敬!您可以免费使用该脚本,但请记住,重新发布代码须遵守我们的网站规则。

免责声明
这些信息和出版物并非旨在提供,也不构成TradingView提供或认可的任何形式的财务、投资、交易或其他类型的建议或推荐。请阅读使用条款了解更多信息。
开源脚本
秉承TradingView的精神,该脚本的作者将其开源,以便交易者可以查看和验证其功能。向作者致敬!您可以免费使用该脚本,但请记住,重新发布代码须遵守我们的网站规则。
免责声明
这些信息和出版物并非旨在提供,也不构成TradingView提供或认可的任何形式的财务、投资、交易或其他类型的建议或推荐。请阅读使用条款了解更多信息。