已更新
Aurora Volume Momentum & MA Ribbon
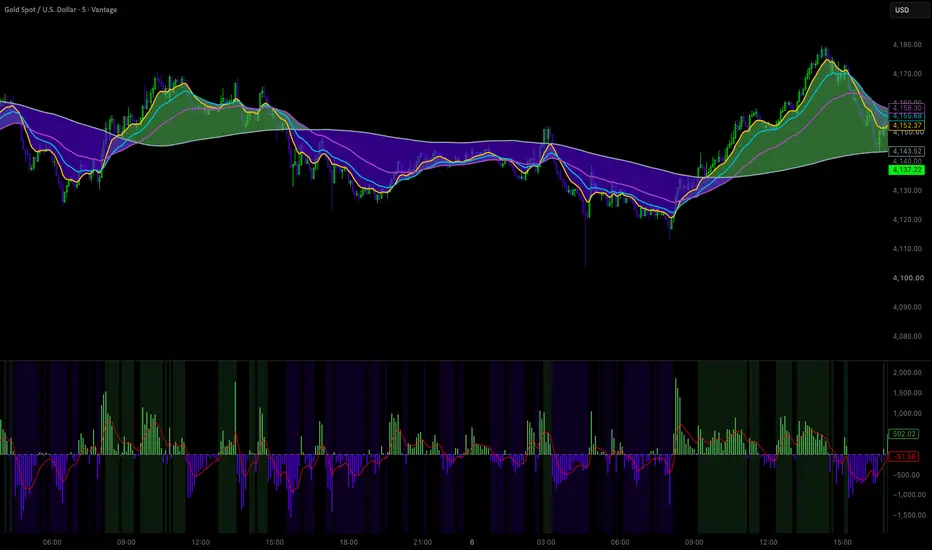
Aurora Volume Momentum & MA Ribbon
Overview
Aurora Volume Momentum & MA Ribbon combines a volume momentum oscillator in a separate pane with an optional, four-line moving average ribbon on the price chart. The oscillator measures smoothed, volume-weighted price changes relative to recent price variability. Background shading identifies when that momentum agrees with price's position around a longer-term SMA. The ribbon adds independently configurable trend context without changing the oscillator calculation.
The design brings together three observations: momentum direction, alignment with a price baseline, and the arrangement of selected moving averages. Each remains visible and interpretable on its own.
Calculation Framework
The oscillator uses the following sequence:
1. Calculate the change between the current close and the previous close.
2. Multiply that change by the chart's reported volume.
3. Smooth the result with an EMA using the Signal Period.
4. Divide the smoothed result by the population standard deviation of closing prices over the Volatility Period.
5. Calculate another EMA of the resulting histogram using the same Signal Period to produce the signal line.
Histogram = EMA((close - previous close) × volume, Signal Period) / Standard Deviation(close, Volatility Period)
Signal Line = EMA(Histogram, Signal Period)
Price Filter = SMA(close, Price Filter MA Length)
Smoothing takes place before volatility normalization. The calculation uses standard deviation of closing prices. It does not use ATR or relative-volume normalization.
The histogram is unbounded and is not expressed as a percentage. Its magnitude depends on the instrument, timeframe, reported volume, and price variability. Values should be evaluated in their own chart context rather than treated as directly comparable across markets or feeds. Lower price deviation can amplify a reading even without an equivalent increase in volume-weighted price change.
Core Calculation — Pine Script Excerpt
Pine Script®
What the Oscillator Displays
Green histogram bars: Positive smoothed, volume-weighted price momentum. A green bar can remain visible during a falling candle because the calculation includes recent price changes through EMA smoothing.
Red histogram bars: Negative smoothed, volume-weighted price momentum. A red bar can remain visible during a rising candle for the same reason.
Blue signal line: An additional EMA of the histogram. Its position above or below zero describes the direction of the more heavily smoothed momentum. The histogram's position relative to this line shows whether its current reading is above or below its recent exponential average. A histogram crossing above the signal line while both remain negative can represent weakening negative momentum.
Dashed zero line: The boundary between positive and negative oscillator values.
The histogram represents a price-and-volume proxy. It does not measure actual buyer-versus-seller executed volume, bid/ask delta, or cumulative volume delta.
Background Interpretation
Background shading combines histogram direction with an independent SMA price filter:
- Green: The histogram is above the positive Momentum Threshold and the close is above the price-filter SMA.
- Red: The histogram is below the negative Momentum Threshold and the close is below the price-filter SMA.
- Neutral: Neither condition is satisfied, including momentum/price disagreement, threshold equality, price at the SMA, or unavailable calculation data.
Neutral regions inherit the chart's background, so their appearance follows the selected TradingView theme. Directional zones use the histogram colors at 85% transparency.
At the default threshold of zero, shading requires a positive or negative histogram together with matching price alignment. Increasing the threshold requires a larger absolute histogram value for shading. This setting controls background qualification and does not create an alert or an entry signal.
Optional Four-Line MA Ribbon
Enable Show MA Ribbon to display up to four moving averages on the main price chart while keeping the oscillator in its own pane. Each line has independent settings for enable/disable, averaging method, length, source, color, and width.
Supported averaging methods:
- EMA: Exponential smoothing with greater weight on recent observations.
- SMA: Arithmetic average over the selected length.
- WMA: Linear weighting toward recent observations.
- RMA: Wilder's smoothing, using a smoothing factor of 1 / length.
- VWMA: Average of the selected source weighted by chart volume.
- HMA: Hull moving average, combining weighted averages to reduce lag.
Optional fills connect adjacent enabled pairs: MA 1–2, MA 2–3, and MA 3–4. A fill is green when the first numbered MA is above the next and red when it is below. Equal values produce no fill. Fill transparency is adjustable. Disabling a line removes both fills connected to that line; the script does not bridge across disabled lines.
MA numbers are not automatically sorted by length. With ascending lengths and comparable averaging methods, consistent ordering can help visualize trend alignment. Mixed ordering identifies disagreement between the selected averages. These are contextual observations rather than automatic trade instructions.
The ribbon operates independently of the oscillator's SMA filter. Changing a ribbon length or method does not change the histogram, signal line, or background conditions.
Default Configuration
- Signal Period: 8
- Volatility Period: 20
- Price Filter MA Length: 200, SMA
- Momentum Threshold: 0
- MA Ribbon: Disabled
- MA 1: 9 EMA, close source
- MA 2: 21 EMA, close source
- MA 3: 50 EMA, close source
- MA 4: 200 SMA, close source
- Adjacent ribbon fills: Enabled when the ribbon is shown; 90% transparency
All four individual MA switches are enabled initially. The master ribbon switch controls whether they appear on the price chart.
Parameter Adjustment
A shorter Signal Period makes both smoothing stages more responsive. A longer period smooths both the histogram and signal line and generally delays directional changes.
The Volatility Period changes the price-deviation denominator. Its effect on magnitude depends on the underlying price sequence; shortening it does not always increase or decrease the histogram.
A shorter Price Filter MA Length makes the background's price baseline respond more quickly. A longer length provides a slower reference. Ribbon lengths and methods can be adjusted separately to inspect short-, medium-, and longer-term price structure.
Data and Real-Time Behavior
All calculations use the current chart's data and timeframe. Higher-timeframe context can be inspected by opening a separate chart or changing the chart timeframe; the script does not request an additional timeframe internally.
The oscillator requires usable volume data and nonzero price standard deviation. Forex and some CFD feeds may report tick volume rather than centralized traded volume. Missing volume or a zero volatility denominator leaves the oscillator unavailable. The ribbon's price-based averages can still function without volume; VWMA requires usable volume.
The current candle's histogram, signal line, ribbon, and shading update as new data arrives. Their appearance can change before the candle closes. The script uses no future-bar references or higher-timeframe lookahead. Historical values can still change if the data provider revises its feed or the user changes settings.
Scope and Attribution
Aurora is a visual analysis indicator. It contains no automatic buy/sell labels, entry rules, alerts, stop-loss levels, profit targets, or backtested strategy results. Momentum alignment does not guarantee continuation or profitability.
Inspiration and Original Author
Aurora Volume Momentum & MA Ribbon is inspired by Nova Volume Indicator by SplitzMagic. Credit for the original indicator concept belongs to SplitzMagic.
This script presents my own interpretation of that idea through an independently written implementation, with the addition of a configurable four-line moving average ribbon. I am sharing my implementation as open source so the community can inspect the calculations, understand the design, and build on this interpretation.
This publication shares my own code. It does not disclose SplitzMagic’s original source code, and it is not an official release, collaboration, or endorsement by the original author.
Overview
Aurora Volume Momentum & MA Ribbon combines a volume momentum oscillator in a separate pane with an optional, four-line moving average ribbon on the price chart. The oscillator measures smoothed, volume-weighted price changes relative to recent price variability. Background shading identifies when that momentum agrees with price's position around a longer-term SMA. The ribbon adds independently configurable trend context without changing the oscillator calculation.
The design brings together three observations: momentum direction, alignment with a price baseline, and the arrangement of selected moving averages. Each remains visible and interpretable on its own.
Calculation Framework
The oscillator uses the following sequence:
1. Calculate the change between the current close and the previous close.
2. Multiply that change by the chart's reported volume.
3. Smooth the result with an EMA using the Signal Period.
4. Divide the smoothed result by the population standard deviation of closing prices over the Volatility Period.
5. Calculate another EMA of the resulting histogram using the same Signal Period to produce the signal line.
Histogram = EMA((close - previous close) × volume, Signal Period) / Standard Deviation(close, Volatility Period)
Signal Line = EMA(Histogram, Signal Period)
Price Filter = SMA(close, Price Filter MA Length)
Smoothing takes place before volatility normalization. The calculation uses standard deviation of closing prices. It does not use ATR or relative-volume normalization.
The histogram is unbounded and is not expressed as a percentage. Its magnitude depends on the instrument, timeframe, reported volume, and price variability. Values should be evaluated in their own chart context rather than treated as directly comparable across markets or feeds. Lower price deviation can amplify a reading even without an equivalent increase in volume-weighted price change.
Core Calculation — Pine Script Excerpt
What the Oscillator Displays
Green histogram bars: Positive smoothed, volume-weighted price momentum. A green bar can remain visible during a falling candle because the calculation includes recent price changes through EMA smoothing.
Red histogram bars: Negative smoothed, volume-weighted price momentum. A red bar can remain visible during a rising candle for the same reason.
Blue signal line: An additional EMA of the histogram. Its position above or below zero describes the direction of the more heavily smoothed momentum. The histogram's position relative to this line shows whether its current reading is above or below its recent exponential average. A histogram crossing above the signal line while both remain negative can represent weakening negative momentum.
Dashed zero line: The boundary between positive and negative oscillator values.
The histogram represents a price-and-volume proxy. It does not measure actual buyer-versus-seller executed volume, bid/ask delta, or cumulative volume delta.
Background Interpretation
Background shading combines histogram direction with an independent SMA price filter:
- Green: The histogram is above the positive Momentum Threshold and the close is above the price-filter SMA.
- Red: The histogram is below the negative Momentum Threshold and the close is below the price-filter SMA.
- Neutral: Neither condition is satisfied, including momentum/price disagreement, threshold equality, price at the SMA, or unavailable calculation data.
Neutral regions inherit the chart's background, so their appearance follows the selected TradingView theme. Directional zones use the histogram colors at 85% transparency.
At the default threshold of zero, shading requires a positive or negative histogram together with matching price alignment. Increasing the threshold requires a larger absolute histogram value for shading. This setting controls background qualification and does not create an alert or an entry signal.
Optional Four-Line MA Ribbon
Enable Show MA Ribbon to display up to four moving averages on the main price chart while keeping the oscillator in its own pane. Each line has independent settings for enable/disable, averaging method, length, source, color, and width.
Supported averaging methods:
- EMA: Exponential smoothing with greater weight on recent observations.
- SMA: Arithmetic average over the selected length.
- WMA: Linear weighting toward recent observations.
- RMA: Wilder's smoothing, using a smoothing factor of 1 / length.
- VWMA: Average of the selected source weighted by chart volume.
- HMA: Hull moving average, combining weighted averages to reduce lag.
Optional fills connect adjacent enabled pairs: MA 1–2, MA 2–3, and MA 3–4. A fill is green when the first numbered MA is above the next and red when it is below. Equal values produce no fill. Fill transparency is adjustable. Disabling a line removes both fills connected to that line; the script does not bridge across disabled lines.
MA numbers are not automatically sorted by length. With ascending lengths and comparable averaging methods, consistent ordering can help visualize trend alignment. Mixed ordering identifies disagreement between the selected averages. These are contextual observations rather than automatic trade instructions.
The ribbon operates independently of the oscillator's SMA filter. Changing a ribbon length or method does not change the histogram, signal line, or background conditions.
Default Configuration
- Signal Period: 8
- Volatility Period: 20
- Price Filter MA Length: 200, SMA
- Momentum Threshold: 0
- MA Ribbon: Disabled
- MA 1: 9 EMA, close source
- MA 2: 21 EMA, close source
- MA 3: 50 EMA, close source
- MA 4: 200 SMA, close source
- Adjacent ribbon fills: Enabled when the ribbon is shown; 90% transparency
All four individual MA switches are enabled initially. The master ribbon switch controls whether they appear on the price chart.
Parameter Adjustment
A shorter Signal Period makes both smoothing stages more responsive. A longer period smooths both the histogram and signal line and generally delays directional changes.
The Volatility Period changes the price-deviation denominator. Its effect on magnitude depends on the underlying price sequence; shortening it does not always increase or decrease the histogram.
A shorter Price Filter MA Length makes the background's price baseline respond more quickly. A longer length provides a slower reference. Ribbon lengths and methods can be adjusted separately to inspect short-, medium-, and longer-term price structure.
Data and Real-Time Behavior
All calculations use the current chart's data and timeframe. Higher-timeframe context can be inspected by opening a separate chart or changing the chart timeframe; the script does not request an additional timeframe internally.
The oscillator requires usable volume data and nonzero price standard deviation. Forex and some CFD feeds may report tick volume rather than centralized traded volume. Missing volume or a zero volatility denominator leaves the oscillator unavailable. The ribbon's price-based averages can still function without volume; VWMA requires usable volume.
The current candle's histogram, signal line, ribbon, and shading update as new data arrives. Their appearance can change before the candle closes. The script uses no future-bar references or higher-timeframe lookahead. Historical values can still change if the data provider revises its feed or the user changes settings.
Scope and Attribution
Aurora is a visual analysis indicator. It contains no automatic buy/sell labels, entry rules, alerts, stop-loss levels, profit targets, or backtested strategy results. Momentum alignment does not guarantee continuation or profitability.
Inspiration and Original Author
Aurora Volume Momentum & MA Ribbon is inspired by Nova Volume Indicator by SplitzMagic. Credit for the original indicator concept belongs to SplitzMagic.
This script presents my own interpretation of that idea through an independently written implementation, with the addition of a configurable four-line moving average ribbon. I am sharing my implementation as open source so the community can inspect the calculations, understand the design, and build on this interpretation.
This publication shares my own code. It does not disclose SplitzMagic’s original source code, and it is not an official release, collaboration, or endorsement by the original author.
版本注释
Updated Colors
免责声明
这些信息和出版物并非旨在提供,也不构成TradingView提供或认可的任何形式的财务、投资、交易或其他类型的建议或推荐。请阅读使用条款了解更多信息。
免责声明
这些信息和出版物并非旨在提供,也不构成TradingView提供或认可的任何形式的财务、投资、交易或其他类型的建议或推荐。请阅读使用条款了解更多信息。