OPEN-SOURCE SCRIPT
Z-Score Flow Pro [JOAT]
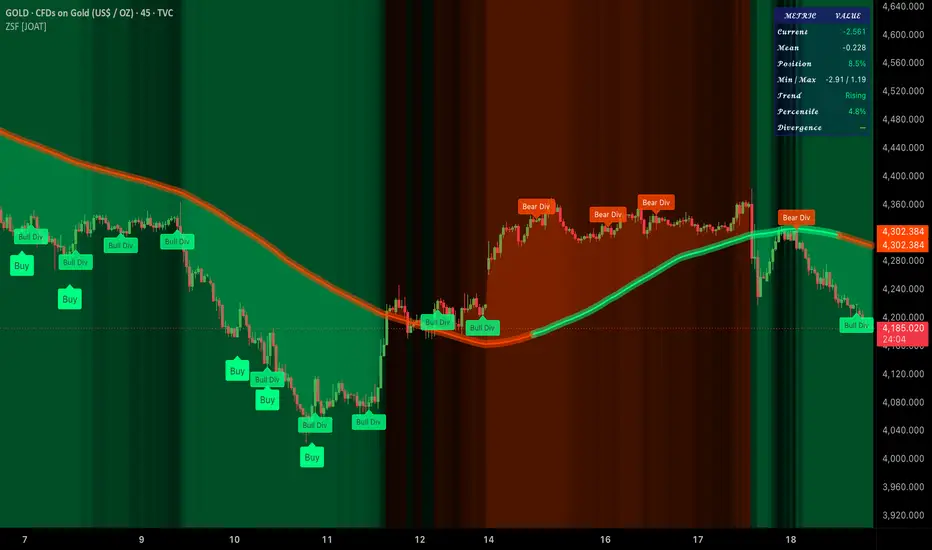
Z-SCORE FLOW PRO [JOAT]
A rigorously-statistical mean-reversion oscillator built on top of two of the cleanest primitives in market analysis — the Z-score of price against its own rolling mean and the EMA-smoothed RSI — and wrapped in a regime-aware visual and signal pipeline that knows when not to fire.

Why Z-score
A Z-score answers the question every reversion trader is really asking: "How many standard deviations is price from where it usually sits?" It is regime-aware by construction — when realised volatility expands, the same dollar move produces a smaller Z; when it contracts, the same dollar move produces a larger Z. That means the signal levels (Z = ±2, ±3, etc.) carry the same statistical meaning across instruments and timeframes, which a price-distance level never does.
Z-Score Flow Pro uses:
A signal needs both the Z-score and the smoothed RSI to be at extremes on the same side — that AND-gating is what removes most of the false signals that pure RSI or pure Z systems produce.
Signal engine
A Buy signal requires Z ≤ Buy threshold (default −2.0) and smoothed RSI ≤ oversold level (default 30). A Sell signal requires Z ≥ Sell threshold (default +2.0) and smoothed RSI ≥ overbought level (default 70). A configurable cooldown prevents back-to-back signals; the labels respect the EMA regime filter so the strongest read is when signal direction agrees with the EMA trend.
Background heatmap (JOAT enhancement)
The chart pane is tinted bull or bear with an intensity proportional to |Z|. The mapping is linear: at Z = 0 the heatmap is nearly invisible, at |Z| = the saturation threshold (default 1.5) the tint reaches its loudest configured opacity. Both ends are tunable, so you can dial the heatmap from "barely there" to "institutional cockpit". This is the cleanest at-a-glance read of how stretched the market is right now — you do not need to read the Z value itself.
Divergence engine (JOAT enhancement)
A slope-comparison divergence runs in parallel: it compares the slope of the Z-score against the slope of price over a configurable lookback. A bullish divergence requires price slope negative and Z slope positive; bearish is the mirror. Both slopes must exceed a small epsilon to suppress flat-region noise, and a divergence cooldown spaces them out. Divergences print directly in the chart pane in the palette colour.
Slope-coloured Z-mean line
The Z-score's own running mean is plotted as a slope-coloured ribbon: bull / bear / flat colours based on the slope over a configurable sensitivity window. The shadow underneath the line uses an alpha-modulated version of the same colour so the line visually breathes with regime.

Dashboard
A compact monospaced table, positionable to any of nine corners, with togglable cell transparency. Rows surface:
Alerts
Alerts are exposed for buy / sell signals, divergences, regime flips, and a configurable Z-extreme alert that fires when |Z| crosses a user-set high level (default 3.0). The extreme alert is the cleanest "the market is genuinely far from home" trigger this script produces and is suitable for end-of-day notification workflows.
How to read it
Three reads, in order of conviction:
Suggested settings
Defaults are tuned for 1H–4H on liquid markets. For 5m–15m, drop Z period to 50 and RSI period to 9. For daily and above, raise Z period to 200 and EMA trend filter to 100. The thresholds (±2.0 Z, 30/70 RSI) are intentionally classic — they correspond to the textbook two-sigma deviation and are well-understood; loosen them only if you are running on a less-liquid instrument.
Originality / what's reused
Z-score and RSI are public-domain mathematics, used here as primitives. The implementation — the smoothed-RSI gating, the slope-coloured Z-mean line with alpha shadow, the |Z|-driven background heatmap, the 252-bar percentile rank, the divergence epsilon filter, and the AND-gated signal pipeline — is JOAT-original and tuned together. No third-party code reused.
Open source
Published open-source under the default Mozilla Public License 2.0. Every section is banner-headed, every helper is documented inline, every input carries a tooltip. The Z-mean line, the heatmap, the divergence engine, and the dashboard are each in their own isolated module so you can study or adapt any single piece without reading the whole file.
Limitations
Z-score mean-reversion is a counter-trend tool by definition. In sustained one-sided trends the Z will live at an extreme for many bars and the signals will give back giveback — the EMA regime filter exists to warn you when you are in this state. The 252-bar percentile rank needs ~1 year of data to be meaningful; on shorter histories it warms up to neutral. Divergences are non-repainting but carry the natural lag of slope-over-window comparison.
—
-made with passion by jackofalltrades
A rigorously-statistical mean-reversion oscillator built on top of two of the cleanest primitives in market analysis — the Z-score of price against its own rolling mean and the EMA-smoothed RSI — and wrapped in a regime-aware visual and signal pipeline that knows when not to fire.
Why Z-score
A Z-score answers the question every reversion trader is really asking: "How many standard deviations is price from where it usually sits?" It is regime-aware by construction — when realised volatility expands, the same dollar move produces a smaller Z; when it contracts, the same dollar move produces a larger Z. That means the signal levels (Z = ±2, ±3, etc.) carry the same statistical meaning across instruments and timeframes, which a price-distance level never does.
Z-Score Flow Pro uses:
- Z-score core — close vs SMA basis, normalised by rolling stdev, over a configurable lookback (default 100).
- EMA trend filter — a long EMA (default 50) decides which side of the chart the engine considers in-regime. Signals are weighted by regime alignment, not blindly suppressed.
- Smoothed RSI — RSI is computed, then EMA-smoothed (default 8-bar) to eliminate the single-bar whipsaws that plague the raw indicator without re-introducing visible lag.
A signal needs both the Z-score and the smoothed RSI to be at extremes on the same side — that AND-gating is what removes most of the false signals that pure RSI or pure Z systems produce.
Signal engine
A Buy signal requires Z ≤ Buy threshold (default −2.0) and smoothed RSI ≤ oversold level (default 30). A Sell signal requires Z ≥ Sell threshold (default +2.0) and smoothed RSI ≥ overbought level (default 70). A configurable cooldown prevents back-to-back signals; the labels respect the EMA regime filter so the strongest read is when signal direction agrees with the EMA trend.
Background heatmap (JOAT enhancement)
The chart pane is tinted bull or bear with an intensity proportional to |Z|. The mapping is linear: at Z = 0 the heatmap is nearly invisible, at |Z| = the saturation threshold (default 1.5) the tint reaches its loudest configured opacity. Both ends are tunable, so you can dial the heatmap from "barely there" to "institutional cockpit". This is the cleanest at-a-glance read of how stretched the market is right now — you do not need to read the Z value itself.
Divergence engine (JOAT enhancement)
A slope-comparison divergence runs in parallel: it compares the slope of the Z-score against the slope of price over a configurable lookback. A bullish divergence requires price slope negative and Z slope positive; bearish is the mirror. Both slopes must exceed a small epsilon to suppress flat-region noise, and a divergence cooldown spaces them out. Divergences print directly in the chart pane in the palette colour.
Slope-coloured Z-mean line
The Z-score's own running mean is plotted as a slope-coloured ribbon: bull / bear / flat colours based on the slope over a configurable sensitivity window. The shadow underneath the line uses an alpha-modulated version of the same colour so the line visually breathes with regime.
Dashboard
A compact monospaced table, positionable to any of nine corners, with togglable cell transparency. Rows surface:
- Current Z-score and its direction (Rising / Falling / Flat).
- One-year (252-bar) percentile of Z — how unusual the current reading is in its own recent history.
- Smoothed RSI and its slope direction.
- Active EMA regime (Up / Down / Neutral).
- Distance of Z from its own min/max range (position-in-Z, 0–100%).
Alerts
Alerts are exposed for buy / sell signals, divergences, regime flips, and a configurable Z-extreme alert that fires when |Z| crosses a user-set high level (default 3.0). The extreme alert is the cleanest "the market is genuinely far from home" trigger this script produces and is suitable for end-of-day notification workflows.
How to read it
Three reads, in order of conviction:
- Background heatmap — a glance tells you whether you are in a normal-Z regime (no tint) or stretched (bright tint). Most of the time, do nothing.
- Signal labels — fade extremes only when both Z and RSI agree, and respect the EMA regime — counter-trend trades into a sustained EMA-aligned move are lower-conviction by definition.
- Divergences — the highest-conviction reads. A bullish divergence with the heatmap saturated bear and the signal in the right direction is the cleanest setup the engine can produce.
Suggested settings
Defaults are tuned for 1H–4H on liquid markets. For 5m–15m, drop Z period to 50 and RSI period to 9. For daily and above, raise Z period to 200 and EMA trend filter to 100. The thresholds (±2.0 Z, 30/70 RSI) are intentionally classic — they correspond to the textbook two-sigma deviation and are well-understood; loosen them only if you are running on a less-liquid instrument.
Originality / what's reused
Z-score and RSI are public-domain mathematics, used here as primitives. The implementation — the smoothed-RSI gating, the slope-coloured Z-mean line with alpha shadow, the |Z|-driven background heatmap, the 252-bar percentile rank, the divergence epsilon filter, and the AND-gated signal pipeline — is JOAT-original and tuned together. No third-party code reused.
Open source
Published open-source under the default Mozilla Public License 2.0. Every section is banner-headed, every helper is documented inline, every input carries a tooltip. The Z-mean line, the heatmap, the divergence engine, and the dashboard are each in their own isolated module so you can study or adapt any single piece without reading the whole file.
Limitations
Z-score mean-reversion is a counter-trend tool by definition. In sustained one-sided trends the Z will live at an extreme for many bars and the signals will give back giveback — the EMA regime filter exists to warn you when you are in this state. The 252-bar percentile rank needs ~1 year of data to be meaningful; on shorter histories it warms up to neutral. Divergences are non-repainting but carry the natural lag of slope-over-window comparison.
—
-made with passion by jackofalltrades
开源脚本
秉承TradingView的精神,该脚本的作者将其开源,以便交易者可以查看和验证其功能。向作者致敬!您可以免费使用该脚本,但请记住,重新发布代码须遵守我们的网站规则。

The Institutional Grade Trading Ecosystem, Built to win trades 📈
Get Access 👇
jackofalltrades.vip 🌐
t.me/jackofalltradesvip 🃏
Get Access 👇
jackofalltrades.vip 🌐
t.me/jackofalltradesvip 🃏
免责声明
这些信息和出版物并非旨在提供,也不构成TradingView提供或认可的任何形式的财务、投资、交易或其他类型的建议或推荐。请阅读使用条款了解更多信息。
开源脚本
秉承TradingView的精神,该脚本的作者将其开源,以便交易者可以查看和验证其功能。向作者致敬!您可以免费使用该脚本,但请记住,重新发布代码须遵守我们的网站规则。
The Institutional Grade Trading Ecosystem, Built to win trades 📈
Get Access 👇
jackofalltrades.vip 🌐
t.me/jackofalltradesvip 🃏
Get Access 👇
jackofalltrades.vip 🌐
t.me/jackofalltradesvip 🃏
免责声明
这些信息和出版物并非旨在提供,也不构成TradingView提供或认可的任何形式的财务、投资、交易或其他类型的建议或推荐。请阅读使用条款了解更多信息。