Gold News Reaction Map
WHAT THIS SCRIPT DOES
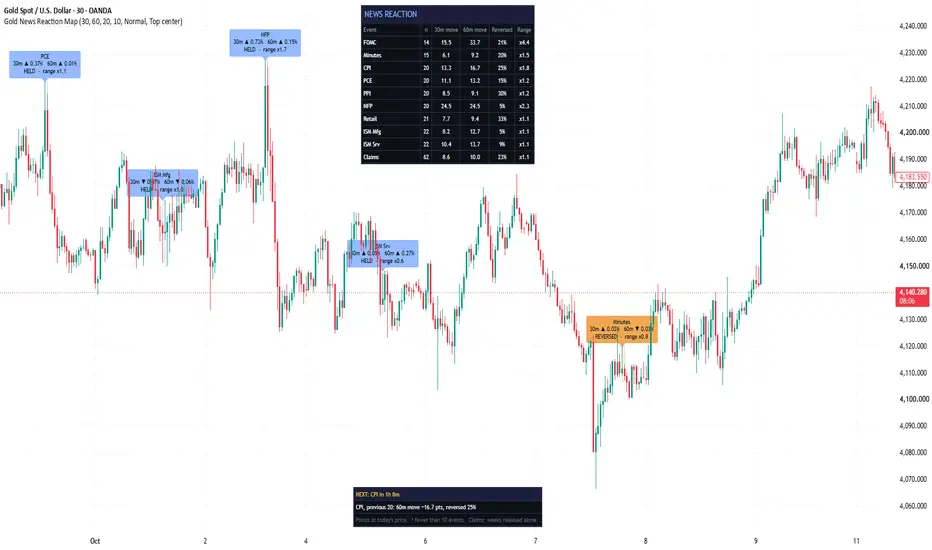
This indicator measures how price actually reacted to scheduled US economic releases: how far it moved in the first minutes after each release, whether that first move held or reversed, and how much wider the window was than the same clock window on a normal day.
It does not predict the next release. It shows what the previous ones did, and how many of them there were, so you can judge whether a sample is large enough to mean anything.
It was built for gold (XAU/USD), where US data drives much of the intraday volatility, but the measurements are generic and can be applied to any instrument that trades through the US morning session.
THE EVENTS
Ten release types are tracked, each with its own switch:
FOMC rate decision (2:00 PM New York)
FOMC minutes (2:00 PM)
CPI (8:30 AM)
PCE / Personal Income and Outlays (8:30 AM)
PPI (8:30 AM)
Employment Situation / NFP (8:30 AM)
Retail sales (8:30 AM)
ISM Manufacturing (10:00 AM)
ISM Services (10:00 AM)
Weekly jobless claims (8:30 AM)
Release dates are stored in the script rather than guessed from rules such as "the first Friday of the month". They come from the official calendars of the Federal Reserve, the Bureau of Labor Statistics, the Bureau of Economic Analysis, the Census Bureau and ISM, including the delayed and cancelled releases of the 2025 government shutdown. Times are New York times, so daylight saving is handled automatically.
HOW EACH RELEASE IS MEASURED
For every release, the script takes the price at the open of the release bar and measures:
First move: where price stands at the end of the first window (15 minutes by default), as a percentage of the pre-release price.
Follow-through: where price stands at the end of the second window (60 minutes by default).
Held or reversed: if the first move and the end of the window are on opposite sides of the pre-release price, the release is marked as reversed.
Range ratio: the high-to-low range of the window, divided by the average range of the same clock window on recent days that had no listed release at that time. A value of x2.0 means the window was twice as wide as a normal day at that hour. Comparing with the same clock time on normal days is fairer than comparing with the quiet hour before the release, because the US open is volatile on its own.
Each release is labelled on the chart with its name, both moves, the held or reversed status and the range ratio, and the measured window is shaded.
RELEASES THAT SHARE A MINUTE
CPI sometimes lands with retail sales, and NFP with retail sales. Releases published at the same minute are measured once, as one reaction. A setting decides whether that reaction is counted in the row of each release involved, or only releases that came out alone are counted, which is cleaner but gives a smaller sample. Weekly jobless claims are always counted only in weeks when no other listed release came out at the same minute; otherwise the reaction belongs to the bigger release.
READING THE PANEL
The summary panel lists every release type that is switched on, with:
n: the number of releases measured in the loaded history. Rows below the minimum sample (10 by default) are greyed and marked with an asterisk.
First move and follow-through: the average size of each move. Moves are averaged in percent, because gold's price has changed a lot over the sample, then converted to points at today's price.
Reversed: the share of releases where the first move did not hold.
Range: the average range ratio against normal days.
A second box shows the next listed release, a countdown to it, and what the previous releases of the same kind did.
SETTINGS
Events: a switch for each release type, and whether to count releases that shared their minute.
Measurement: the two windows, the number of normal days in the baseline, the minimum sample, and a start date for counting, so two settings can be compared over exactly the same period.
Display: labels, shaded windows, the panel, its text size and its position.
LIMITATIONS - PLEASE READ
It runs on minute charts whose timeframe divides 30 minutes (1, 2, 3, 5, 10, 15 or 30). The windows are rounded up to whole bars, so on a 30-minute chart a 15-minute first window becomes 30 minutes.
The sample is limited by the history your chart loads. Lower timeframes give more precise windows but fewer releases. A 30-minute chart covers more releases than a 15-minute one.
The release calendar is stored in the script. It currently runs to the end of 2027 for the main releases; dates that agencies had not yet published when this version was released will be added in later updates. If an agency moves a release, the script will measure the old time until it is updated.
Only the ten listed releases are known to the script. If an unlisted report, such as GDP, comes out at the same minute, its effect is included in the listed release's reaction.
It measures the reaction, not the surprise. It does not know the forecast, the actual figure or the revision, so it cannot tell a big miss from a small one.
Bars are evaluated only after they close, so nothing repaints. A release is skipped if the chart has no bar starting at the release time, for example on a holiday or inside a data gap.
The moves are measured from the open of the release bar. On some feeds the first tick of a release can arrive a moment before or after the bar opens.
ON PERFORMANCE CLAIMS
This publication makes no claim about trading results. It does not generate entries, exits or signals. It reports how price behaved around past releases, with the sample size beside every figure, so you can decide for yourself how much weight to give it. Past reactions do not guarantee future reactions.
ORIGINALITY
Economic-calendar overlays usually stop at marking the time of a release. The original work here is in the measurement: a stored calendar of official release times instead of rule-based guesses, a reaction measured in two windows with an explicit held-or-reversed test, a range ratio against the same clock window on release-free days rather than against the preceding hour, handling of releases that share the same minute, and a sample-size check on every row. The code is published open-source so every date and every rule can be inspected.
This indicator measures how price actually reacted to scheduled US economic releases: how far it moved in the first minutes after each release, whether that first move held or reversed, and how much wider the window was than the same clock window on a normal day.
It does not predict the next release. It shows what the previous ones did, and how many of them there were, so you can judge whether a sample is large enough to mean anything.
It was built for gold (XAU/USD), where US data drives much of the intraday volatility, but the measurements are generic and can be applied to any instrument that trades through the US morning session.
THE EVENTS
Ten release types are tracked, each with its own switch:
FOMC rate decision (2:00 PM New York)
FOMC minutes (2:00 PM)
CPI (8:30 AM)
PCE / Personal Income and Outlays (8:30 AM)
PPI (8:30 AM)
Employment Situation / NFP (8:30 AM)
Retail sales (8:30 AM)
ISM Manufacturing (10:00 AM)
ISM Services (10:00 AM)
Weekly jobless claims (8:30 AM)
Release dates are stored in the script rather than guessed from rules such as "the first Friday of the month". They come from the official calendars of the Federal Reserve, the Bureau of Labor Statistics, the Bureau of Economic Analysis, the Census Bureau and ISM, including the delayed and cancelled releases of the 2025 government shutdown. Times are New York times, so daylight saving is handled automatically.
HOW EACH RELEASE IS MEASURED
For every release, the script takes the price at the open of the release bar and measures:
First move: where price stands at the end of the first window (15 minutes by default), as a percentage of the pre-release price.
Follow-through: where price stands at the end of the second window (60 minutes by default).
Held or reversed: if the first move and the end of the window are on opposite sides of the pre-release price, the release is marked as reversed.
Range ratio: the high-to-low range of the window, divided by the average range of the same clock window on recent days that had no listed release at that time. A value of x2.0 means the window was twice as wide as a normal day at that hour. Comparing with the same clock time on normal days is fairer than comparing with the quiet hour before the release, because the US open is volatile on its own.
Each release is labelled on the chart with its name, both moves, the held or reversed status and the range ratio, and the measured window is shaded.
RELEASES THAT SHARE A MINUTE
CPI sometimes lands with retail sales, and NFP with retail sales. Releases published at the same minute are measured once, as one reaction. A setting decides whether that reaction is counted in the row of each release involved, or only releases that came out alone are counted, which is cleaner but gives a smaller sample. Weekly jobless claims are always counted only in weeks when no other listed release came out at the same minute; otherwise the reaction belongs to the bigger release.
READING THE PANEL
The summary panel lists every release type that is switched on, with:
n: the number of releases measured in the loaded history. Rows below the minimum sample (10 by default) are greyed and marked with an asterisk.
First move and follow-through: the average size of each move. Moves are averaged in percent, because gold's price has changed a lot over the sample, then converted to points at today's price.
Reversed: the share of releases where the first move did not hold.
Range: the average range ratio against normal days.
A second box shows the next listed release, a countdown to it, and what the previous releases of the same kind did.
SETTINGS
Events: a switch for each release type, and whether to count releases that shared their minute.
Measurement: the two windows, the number of normal days in the baseline, the minimum sample, and a start date for counting, so two settings can be compared over exactly the same period.
Display: labels, shaded windows, the panel, its text size and its position.
LIMITATIONS - PLEASE READ
It runs on minute charts whose timeframe divides 30 minutes (1, 2, 3, 5, 10, 15 or 30). The windows are rounded up to whole bars, so on a 30-minute chart a 15-minute first window becomes 30 minutes.
The sample is limited by the history your chart loads. Lower timeframes give more precise windows but fewer releases. A 30-minute chart covers more releases than a 15-minute one.
The release calendar is stored in the script. It currently runs to the end of 2027 for the main releases; dates that agencies had not yet published when this version was released will be added in later updates. If an agency moves a release, the script will measure the old time until it is updated.
Only the ten listed releases are known to the script. If an unlisted report, such as GDP, comes out at the same minute, its effect is included in the listed release's reaction.
It measures the reaction, not the surprise. It does not know the forecast, the actual figure or the revision, so it cannot tell a big miss from a small one.
Bars are evaluated only after they close, so nothing repaints. A release is skipped if the chart has no bar starting at the release time, for example on a holiday or inside a data gap.
The moves are measured from the open of the release bar. On some feeds the first tick of a release can arrive a moment before or after the bar opens.
ON PERFORMANCE CLAIMS
This publication makes no claim about trading results. It does not generate entries, exits or signals. It reports how price behaved around past releases, with the sample size beside every figure, so you can decide for yourself how much weight to give it. Past reactions do not guarantee future reactions.
ORIGINALITY
Economic-calendar overlays usually stop at marking the time of a release. The original work here is in the measurement: a stored calendar of official release times instead of rule-based guesses, a reaction measured in two windows with an explicit held-or-reversed test, a range ratio against the same clock window on release-free days rather than against the preceding hour, handling of releases that share the same minute, and a sample-size check on every row. The code is published open-source so every date and every rule can be inspected.

免责声明
这些信息和出版物并非旨在提供,也不构成TradingView提供或认可的任何形式的财务、投资、交易或其他类型的建议或推荐。请阅读使用条款了解更多信息。