OPEN-SOURCE SCRIPT
Pre-Market High/Low + ORBs + EMAs + VWAP + Pivots [v6]
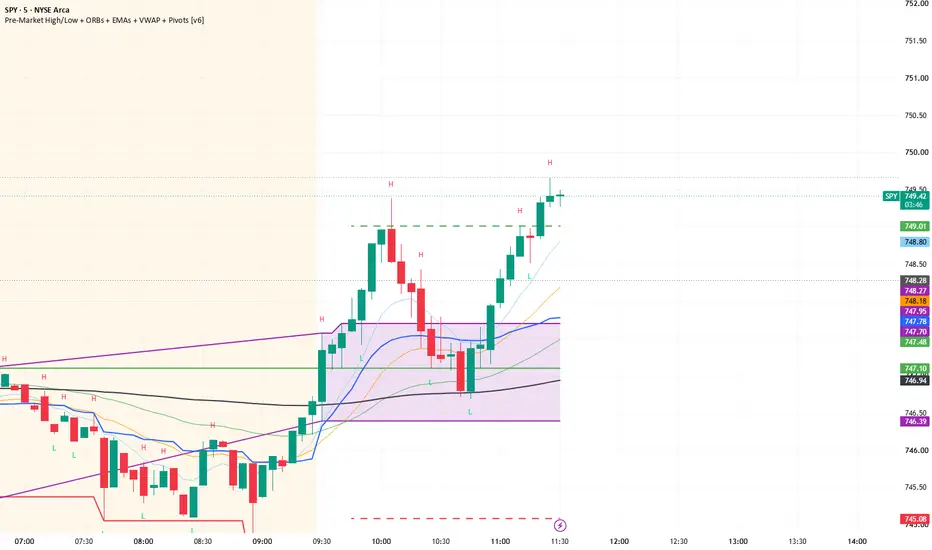
## Pre-Market Levels, ORBs, EMAs, VWAP & Confirmed Pivots
This all-in-one intraday indicator combines frequently used market-reference levels into a single, clean chart overlay. It is designed to help traders monitor pre-market structure, opening ranges, trend context, projected targets, and confirmed swing points.
### Features
**Pre-Market High and Low**
Tracks the highest and lowest prices during the U.S. pre-market session from **4:00 AM to 9:30 AM Eastern Time**. These levels remain visible throughout the trading day as potential support, resistance, liquidity, and breakout reference points.
**First Opening Range**
Calculates the high and low formed between **9:30 AM and 9:45 AM Eastern Time**.
**Second Opening Range**
Calculates an additional high and low between **2:30 PM and 2:40 PM Eastern Time** for traders monitoring afternoon price expansion.
**100% ORB Projection Targets**
After an opening range is complete, the indicator projects one full range above and below it:
```text
Upside target = ORB high + ORB size
Downside target = ORB low − ORB size
```
The morning ORB targets are replaced by the afternoon ORB targets after the second opening range is complete.
**Moving Averages**
Includes the following exponential moving averages:
- 9 EMA
- 21 EMA
- 50 EMA
- 100 EMA
- 200 EMA
These can help evaluate short-, medium-, and long-term trend alignment.
**VWAP**
Displays the session Volume Weighted Average Price as an intraday measure of price relative to traded volume.
**Confirmed Pivot Highs and Lows**
Identifies confirmed swing points:
- Red **H** markers indicate pivot highs.
- Green **L** markers indicate pivot lows.
- The pivot period can be adjusted in the indicator settings.
- Pivot highs and lows can be shown or hidden independently.
Pivots require bars on both sides of the swing to be confirmed. Markers are displayed on the candle where the swing occurred, but the pivot was not known until the required confirmation bars had closed.
### Intended Use
This indicator can help traders identify:
- Pre-market breakouts and rejections
- Opening-range breakouts
- Potential support and resistance
- ORB expansion targets
- Trend alignment using EMAs and VWAP
- Confirmed short-term market structure
The indicator is intended primarily for intraday charts and uses the **America/New_York** timezone for its session calculations.
### Important Notice
This indicator provides technical reference levels only. It does not generate automatic trade entries or guarantee that projected targets will be reached. Always use appropriate confirmation, risk management, and independent analysis. This script is for educational and informational purposes only.
This all-in-one intraday indicator combines frequently used market-reference levels into a single, clean chart overlay. It is designed to help traders monitor pre-market structure, opening ranges, trend context, projected targets, and confirmed swing points.
### Features
**Pre-Market High and Low**
Tracks the highest and lowest prices during the U.S. pre-market session from **4:00 AM to 9:30 AM Eastern Time**. These levels remain visible throughout the trading day as potential support, resistance, liquidity, and breakout reference points.
**First Opening Range**
Calculates the high and low formed between **9:30 AM and 9:45 AM Eastern Time**.
**Second Opening Range**
Calculates an additional high and low between **2:30 PM and 2:40 PM Eastern Time** for traders monitoring afternoon price expansion.
**100% ORB Projection Targets**
After an opening range is complete, the indicator projects one full range above and below it:
```text
Upside target = ORB high + ORB size
Downside target = ORB low − ORB size
```
The morning ORB targets are replaced by the afternoon ORB targets after the second opening range is complete.
**Moving Averages**
Includes the following exponential moving averages:
- 9 EMA
- 21 EMA
- 50 EMA
- 100 EMA
- 200 EMA
These can help evaluate short-, medium-, and long-term trend alignment.
**VWAP**
Displays the session Volume Weighted Average Price as an intraday measure of price relative to traded volume.
**Confirmed Pivot Highs and Lows**
Identifies confirmed swing points:
- Red **H** markers indicate pivot highs.
- Green **L** markers indicate pivot lows.
- The pivot period can be adjusted in the indicator settings.
- Pivot highs and lows can be shown or hidden independently.
Pivots require bars on both sides of the swing to be confirmed. Markers are displayed on the candle where the swing occurred, but the pivot was not known until the required confirmation bars had closed.
### Intended Use
This indicator can help traders identify:
- Pre-market breakouts and rejections
- Opening-range breakouts
- Potential support and resistance
- ORB expansion targets
- Trend alignment using EMAs and VWAP
- Confirmed short-term market structure
The indicator is intended primarily for intraday charts and uses the **America/New_York** timezone for its session calculations.
### Important Notice
This indicator provides technical reference levels only. It does not generate automatic trade entries or guarantee that projected targets will be reached. Always use appropriate confirmation, risk management, and independent analysis. This script is for educational and informational purposes only.
开源脚本
秉承TradingView的精神,该脚本的作者将其开源,以便交易者可以查看和验证其功能。向作者致敬!您可以免费使用该脚本,但请记住,重新发布代码须遵守我们的网站规则。

免责声明
这些信息和出版物并非旨在提供,也不构成TradingView提供或认可的任何形式的财务、投资、交易或其他类型的建议或推荐。请阅读使用条款了解更多信息。
开源脚本
秉承TradingView的精神,该脚本的作者将其开源,以便交易者可以查看和验证其功能。向作者致敬!您可以免费使用该脚本,但请记住,重新发布代码须遵守我们的网站规则。
免责声明
这些信息和出版物并非旨在提供,也不构成TradingView提供或认可的任何形式的财务、投资、交易或其他类型的建议或推荐。请阅读使用条款了解更多信息。