Mo3ty RSI - Signals and Divergence
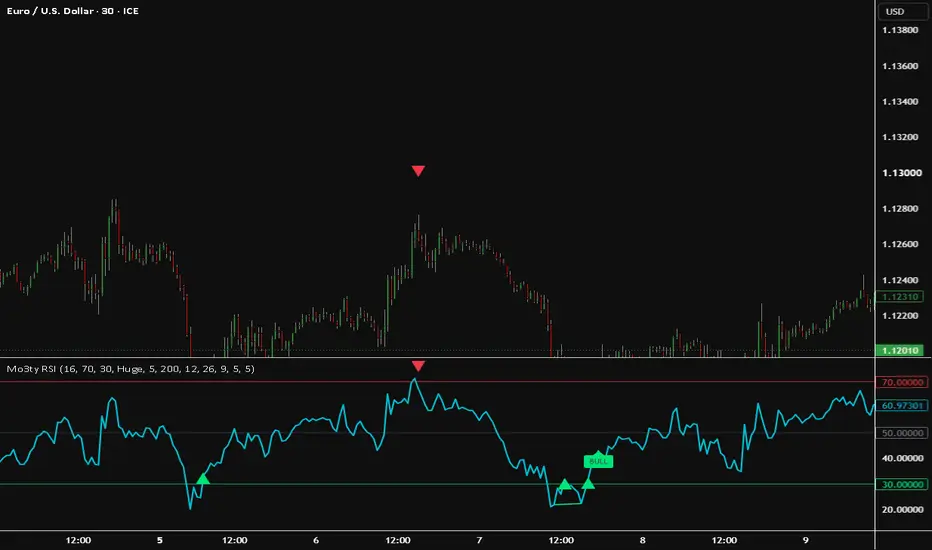
# Mo3ty RSI - Signals and Divergence
## Overview
Mo3ty RSI is an open-source technical analysis indicator designed to identify potential momentum reversal signals and bullish or bearish RSI divergence. It combines configurable RSI levels, optional MACD confirmation, optional trend and candle filters, and pivot-based divergence detection in one customizable indicator.
The indicator is designed to support technical analysis and discretionary trading decisions. It does not guarantee profitable trades or predict future prices.
## Key Features
### 1. RSI Buy and Sell Signals
The indicator uses the Relative Strength Index (RSI) to identify potential reversal opportunities.
- Buy signal: RSI crosses back above the selected oversold level.
- Sell signal: RSI crosses back below the selected overbought level.
- Signals are evaluated at candle close.
Default RSI settings:
- RSI Length: 16
- Overbought Level: 70
- Oversold Level: 30
All three settings can be adjusted.
### 2. Optional MACD Confirmation
The MACD filter helps users evaluate momentum alignment when a potential RSI signal occurs.
- Buy signals require the MACD line to be above the MACD signal line when the filter is enabled.
- Sell signals require the MACD line to be below the MACD signal line when the filter is enabled.
Default MACD parameters:
- Fast Length: 12
- Slow Length: 26
- Signal Length: 9
The MACD filter is disabled by default and can be enabled or disabled in the settings.
### 3. Optional EMA Trend Filter
Users can enable an Exponential Moving Average (EMA) filter to restrict signals according to price position relative to the selected EMA.
- Buy signals require the closing price to be above the EMA.
- Sell signals require the closing price to be below the EMA.
The default EMA length is 200. This filter is disabled by default.
### 4. Optional Candle Direction Filter
When enabled:
- Buy signals require a bullish candle.
- Sell signals require a bearish candle.
This filter is disabled by default.
### 5. Bullish and Bearish RSI Divergence
The indicator identifies potential divergence by comparing price swing points with corresponding RSI values.
- Bullish divergence: price forms a lower low while RSI forms a higher low.
- Bearish divergence: price forms a higher high while RSI forms a lower high.
An optional RSI zone filter requires at least one of the compared RSI pivot values to reach the relevant oversold or overbought zone.
Divergence labels and lines can be configured independently for the price chart and RSI pane.
### 6. Pivot Confirmation
Users can adjust:
- Pivot Left
- Pivot Confirmation Bars
Both settings default to 5 bars.
Pivot confirmation requires subsequent bars to validate a potential swing point. Consequently, divergence signals are delayed by the selected confirmation period. This is an intentional feature of pivot-based detection.
### 7. Customizable Display
Available display options include:
- Buy and sell arrows on the price chart.
- Buy and sell arrows in the RSI pane.
- Adjustable arrow size and RSI-pane arrow distance.
- Configurable RSI, bullish, and bearish colors.
- Independent visibility settings for divergence labels and lines.
### 8. Alerts
The indicator provides alert conditions for:
- RSI Buy
- RSI Sell
- Bullish Divergence
- Bearish Divergence
Users can create alerts through TradingView's alert interface.
## How to Use
1. Add Mo3ty RSI to a chart.
2. Review the default RSI levels and adjust them if needed.
3. Enable the MACD filter if momentum confirmation is desired.
4. Optionally enable the EMA trend filter or candle direction filter.
5. Adjust pivot settings to control swing-point confirmation.
6. Review signals in the context of price structure, market conditions, and independent risk-management rules.
## Originality and Design
Mo3ty RSI combines RSI threshold-return signals with optional MACD state confirmation, optional EMA and candle-direction filters, and separately configurable pivot-based divergence visualization. Its purpose is to provide a unified and adjustable workflow for examining momentum reversals and potential divergence without requiring users to combine multiple separate indicators manually.
## Limitations and Risk Disclosure
Technical indicators can produce false signals, particularly during sideways markets, sudden price movements, and changing market conditions.
MACD and EMA filters may reduce the number of signals but can also delay entries or exclude potentially valid opportunities. Pivot-based divergence detection necessarily involves confirmation delay.
Signals are calculated using the available chart data and the selected settings. Confirmed signals are evaluated at candle close; divergence is recognized only after the relevant pivot is confirmed. This does not guarantee that every signal will be profitable or that all market risks can be avoided.
The indicator is an analytical tool, not financial advice. Always conduct independent research and apply appropriate risk management before making trading decisions.
## Open-Source Notice
Mo3ty RSI is published as an open-source script for the TradingView community. Users can inspect the source code and learn from its implementation, subject to the applicable license and TradingView's script publishing rules.
## Overview
Mo3ty RSI is an open-source technical analysis indicator designed to identify potential momentum reversal signals and bullish or bearish RSI divergence. It combines configurable RSI levels, optional MACD confirmation, optional trend and candle filters, and pivot-based divergence detection in one customizable indicator.
The indicator is designed to support technical analysis and discretionary trading decisions. It does not guarantee profitable trades or predict future prices.
## Key Features
### 1. RSI Buy and Sell Signals
The indicator uses the Relative Strength Index (RSI) to identify potential reversal opportunities.
- Buy signal: RSI crosses back above the selected oversold level.
- Sell signal: RSI crosses back below the selected overbought level.
- Signals are evaluated at candle close.
Default RSI settings:
- RSI Length: 16
- Overbought Level: 70
- Oversold Level: 30
All three settings can be adjusted.
### 2. Optional MACD Confirmation
The MACD filter helps users evaluate momentum alignment when a potential RSI signal occurs.
- Buy signals require the MACD line to be above the MACD signal line when the filter is enabled.
- Sell signals require the MACD line to be below the MACD signal line when the filter is enabled.
Default MACD parameters:
- Fast Length: 12
- Slow Length: 26
- Signal Length: 9
The MACD filter is disabled by default and can be enabled or disabled in the settings.
### 3. Optional EMA Trend Filter
Users can enable an Exponential Moving Average (EMA) filter to restrict signals according to price position relative to the selected EMA.
- Buy signals require the closing price to be above the EMA.
- Sell signals require the closing price to be below the EMA.
The default EMA length is 200. This filter is disabled by default.
### 4. Optional Candle Direction Filter
When enabled:
- Buy signals require a bullish candle.
- Sell signals require a bearish candle.
This filter is disabled by default.
### 5. Bullish and Bearish RSI Divergence
The indicator identifies potential divergence by comparing price swing points with corresponding RSI values.
- Bullish divergence: price forms a lower low while RSI forms a higher low.
- Bearish divergence: price forms a higher high while RSI forms a lower high.
An optional RSI zone filter requires at least one of the compared RSI pivot values to reach the relevant oversold or overbought zone.
Divergence labels and lines can be configured independently for the price chart and RSI pane.
### 6. Pivot Confirmation
Users can adjust:
- Pivot Left
- Pivot Confirmation Bars
Both settings default to 5 bars.
Pivot confirmation requires subsequent bars to validate a potential swing point. Consequently, divergence signals are delayed by the selected confirmation period. This is an intentional feature of pivot-based detection.
### 7. Customizable Display
Available display options include:
- Buy and sell arrows on the price chart.
- Buy and sell arrows in the RSI pane.
- Adjustable arrow size and RSI-pane arrow distance.
- Configurable RSI, bullish, and bearish colors.
- Independent visibility settings for divergence labels and lines.
### 8. Alerts
The indicator provides alert conditions for:
- RSI Buy
- RSI Sell
- Bullish Divergence
- Bearish Divergence
Users can create alerts through TradingView's alert interface.
## How to Use
1. Add Mo3ty RSI to a chart.
2. Review the default RSI levels and adjust them if needed.
3. Enable the MACD filter if momentum confirmation is desired.
4. Optionally enable the EMA trend filter or candle direction filter.
5. Adjust pivot settings to control swing-point confirmation.
6. Review signals in the context of price structure, market conditions, and independent risk-management rules.
## Originality and Design
Mo3ty RSI combines RSI threshold-return signals with optional MACD state confirmation, optional EMA and candle-direction filters, and separately configurable pivot-based divergence visualization. Its purpose is to provide a unified and adjustable workflow for examining momentum reversals and potential divergence without requiring users to combine multiple separate indicators manually.
## Limitations and Risk Disclosure
Technical indicators can produce false signals, particularly during sideways markets, sudden price movements, and changing market conditions.
MACD and EMA filters may reduce the number of signals but can also delay entries or exclude potentially valid opportunities. Pivot-based divergence detection necessarily involves confirmation delay.
Signals are calculated using the available chart data and the selected settings. Confirmed signals are evaluated at candle close; divergence is recognized only after the relevant pivot is confirmed. This does not guarantee that every signal will be profitable or that all market risks can be avoided.
The indicator is an analytical tool, not financial advice. Always conduct independent research and apply appropriate risk management before making trading decisions.
## Open-Source Notice
Mo3ty RSI is published as an open-source script for the TradingView community. Users can inspect the source code and learn from its implementation, subject to the applicable license and TradingView's script publishing rules.

免责声明
这些信息和出版物并非旨在提供,也不构成TradingView提供或认可的任何形式的财务、投资、交易或其他类型的建议或推荐。请阅读使用条款了解更多信息。
免责声明
这些信息和出版物并非旨在提供,也不构成TradingView提供或认可的任何形式的财务、投资、交易或其他类型的建议或推荐。请阅读使用条款了解更多信息。