OPEN-SOURCE SCRIPT
Relative Volume (RVOL) Surge Dashboard
Overview
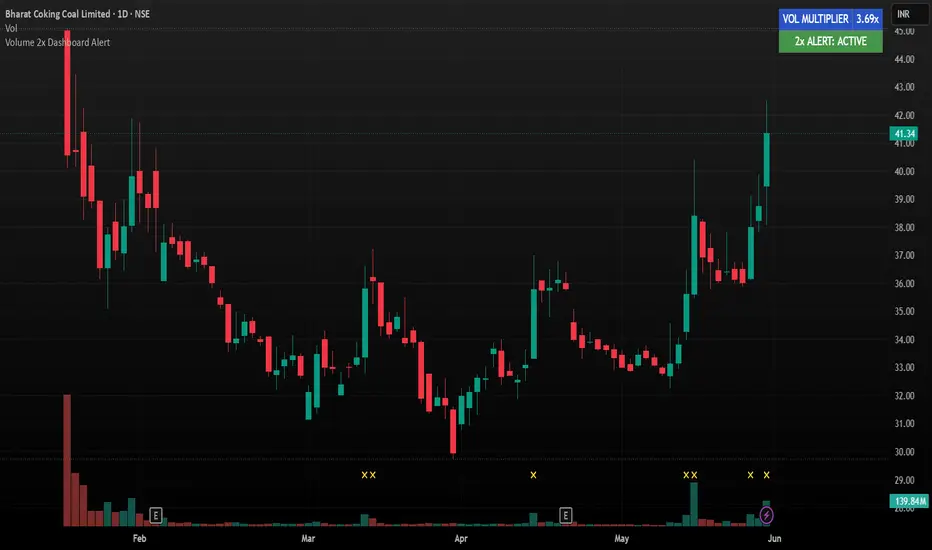
The **Relative Volume (RVOL) Surge Dashboard** is a utility script designed to visually isolate institutional activity and anomalies in volume. In financial markets, sudden volume spikes that double the recent average often signal institutional presence, news-driven breakouts, or potential trend exhaustion points.
This indicator keeps your main chart clean while feeding you live volume metrics via an on-chart HUD (Heads-Up Display).
Key Features
* **Live Relative Volume Multiplier: ** Instantly displays exactly how many times the current bar's volume is exceeding its standard historical moving average (e.g., 1.54x, 3.10x).
* **Smart UI Dashboard: ** A customizable, clean panel that switches colors (Green/Red) immediately depending on whether a 2x volume surge is active or normal.
* **On-Chart Signals: ** Draws a clean yellow cross at the bottom of the price bar whenever a volume anomaly occurs.
* **Built-in Alert Engine: ** Supports native Trading View alert conditions so you can receive push notifications, email, or webhook alerts the exact second a volume anomaly prints.
How to Use It
1. **Trend Breakout Confirmation: ** Look for the dashboard to trigger a green "2x ALERT: ACTIVE" during a consolidation breakout. High volume confirms validity.
2. **Climactic Reversals: ** If a stock has been in an extended downtrend/uptrend and suddenly prints a massive 2x+ volume spike without making significant price progress, look for a potential reversal.
3. **Customization: ** Use the settings panel to change the lookback period (default is 20 bars) or move the dashboard to any corner of your screen to prevent overlapping other indicators.
DISCLAIMER:
This script is created for educational, informational, and utility purposes only. It does not constitute financial, investment, or trading advice. Past performance of any volume metrics or technical signals is not indicative of future results. Financial markets involve substantial risk of loss, and individual traders are entirely responsible for their own capital allocation and risk management. Always perform your own due diligence before entering any trade.
The **Relative Volume (RVOL) Surge Dashboard** is a utility script designed to visually isolate institutional activity and anomalies in volume. In financial markets, sudden volume spikes that double the recent average often signal institutional presence, news-driven breakouts, or potential trend exhaustion points.
This indicator keeps your main chart clean while feeding you live volume metrics via an on-chart HUD (Heads-Up Display).
Key Features
* **Live Relative Volume Multiplier: ** Instantly displays exactly how many times the current bar's volume is exceeding its standard historical moving average (e.g., 1.54x, 3.10x).
* **Smart UI Dashboard: ** A customizable, clean panel that switches colors (Green/Red) immediately depending on whether a 2x volume surge is active or normal.
* **On-Chart Signals: ** Draws a clean yellow cross at the bottom of the price bar whenever a volume anomaly occurs.
* **Built-in Alert Engine: ** Supports native Trading View alert conditions so you can receive push notifications, email, or webhook alerts the exact second a volume anomaly prints.
How to Use It
1. **Trend Breakout Confirmation: ** Look for the dashboard to trigger a green "2x ALERT: ACTIVE" during a consolidation breakout. High volume confirms validity.
2. **Climactic Reversals: ** If a stock has been in an extended downtrend/uptrend and suddenly prints a massive 2x+ volume spike without making significant price progress, look for a potential reversal.
3. **Customization: ** Use the settings panel to change the lookback period (default is 20 bars) or move the dashboard to any corner of your screen to prevent overlapping other indicators.
DISCLAIMER:
This script is created for educational, informational, and utility purposes only. It does not constitute financial, investment, or trading advice. Past performance of any volume metrics or technical signals is not indicative of future results. Financial markets involve substantial risk of loss, and individual traders are entirely responsible for their own capital allocation and risk management. Always perform your own due diligence before entering any trade.
开源脚本
秉承TradingView的精神,该脚本的作者将其开源,以便交易者可以查看和验证其功能。向作者致敬!您可以免费使用该脚本,但请记住,重新发布代码须遵守我们的网站规则。

免责声明
这些信息和出版物并非旨在提供,也不构成TradingView提供或认可的任何形式的财务、投资、交易或其他类型的建议或推荐。请阅读使用条款了解更多信息。
免责声明
这些信息和出版物并非旨在提供,也不构成TradingView提供或认可的任何形式的财务、投资、交易或其他类型的建议或推荐。请阅读使用条款了解更多信息。