已更新
Bitcoin 4-Year Cycle Lookback Marker
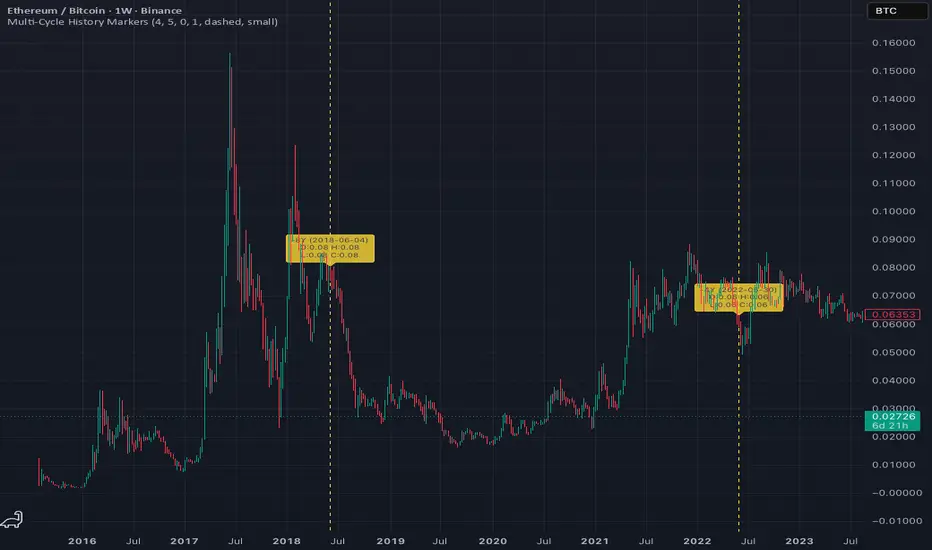
Automatically plots a vertical marker at the bar occurring exactly N years ago (default: 4 years), allowing traders and investors to quickly locate and study historical market conditions, cycle lows, cycle highs, and key events from prior Bitcoin market cycles.
Full Description:
The Bitcoin 4-Year Cycle Lookback Marker is designed for cycle analysis and historical market research.
Instead of manually scrolling through years of price action, this indicator automatically places a vertical marker on the chart at a configurable lookback period, making it easy to compare current market conditions with prior cycle stages.
Features:
• Adjustable lookback period (default 4 years)
• Fine-tuning with day offsets
• Customizable marker color, width, and style
• Optional historical price and date labels
• Works across all chart timeframes
• Designed for Bitcoin cycle and halving-cycle analysis
Common Uses:
• Identify where Bitcoin traded four years ago today
• Compare current market structure to previous cycles
• Locate historical highs, lows, consolidations, and breakouts
• Study market behavior before and after halving events
• Build data-driven cycle frameworks
This indicator is intended as a research and educational tool and does not provide trading signals or financial advice.
Full Description:
The Bitcoin 4-Year Cycle Lookback Marker is designed for cycle analysis and historical market research.
Instead of manually scrolling through years of price action, this indicator automatically places a vertical marker on the chart at a configurable lookback period, making it easy to compare current market conditions with prior cycle stages.
Features:
• Adjustable lookback period (default 4 years)
• Fine-tuning with day offsets
• Customizable marker color, width, and style
• Optional historical price and date labels
• Works across all chart timeframes
• Designed for Bitcoin cycle and halving-cycle analysis
Common Uses:
• Identify where Bitcoin traded four years ago today
• Compare current market structure to previous cycles
• Locate historical highs, lows, consolidations, and breakouts
• Study market behavior before and after halving events
• Build data-driven cycle frameworks
This indicator is intended as a research and educational tool and does not provide trading signals or financial advice.
版本注释
Automatically plots a vertical marker at the bar occurring exactly N years ago (default: 4 years), allowing traders and investors to quickly locate and study historical market conditions, cycle lows, cycle highs, and key events from prior Bitcoin market cycles.Full Description:
The Bitcoin 4-Year Cycle Lookback Marker is designed for cycle analysis and historical market research.
Instead of manually scrolling through years of price action, this indicator automatically places a vertical marker on the chart at a configurable lookback period, making it easy to compare current market conditions with prior cycle stages.
Features:
• Adjustable lookback period (default 4 years)
• Fine-tuning with day offsets
• Customizable marker color, width, and style
• Optional historical price and date labels
• Works across all chart timeframes
• Designed for Bitcoin cycle and halving-cycle analysis
Common Uses:
• Identify where Bitcoin traded four years ago today
• Compare current market structure to previous cycles
• Locate historical highs, lows, consolidations, and breakouts
• Study market behavior before and after halving events
• Build data-driven cycle frameworks
This indicator is intended as a research and educational tool and does not provide trading signals or financial advice.

免责声明
这些信息和出版物并非旨在提供,也不构成TradingView提供或认可的任何形式的财务、投资、交易或其他类型的建议或推荐。请阅读使用条款了解更多信息。