OPEN-SOURCE SCRIPT
COT: Noncommercial Net (Futures)
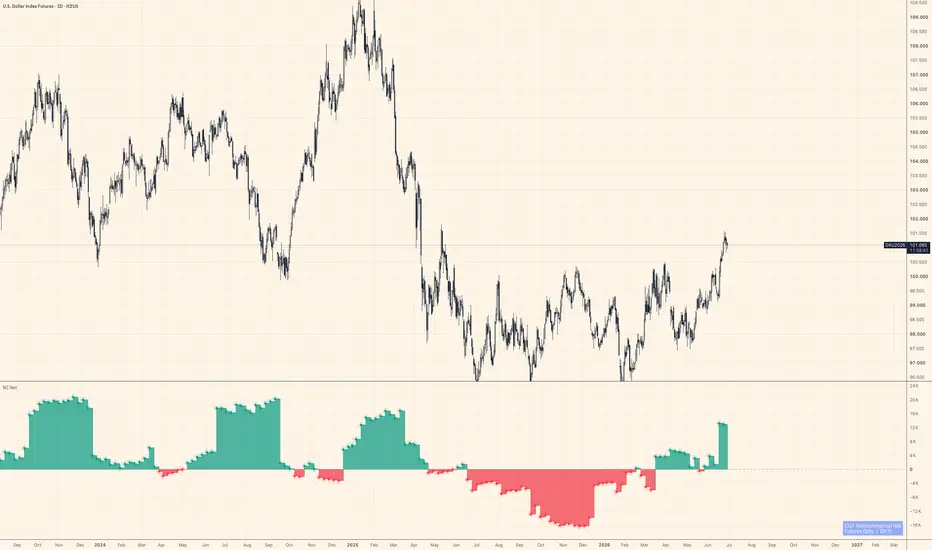
The CFTC publishes Commitment of Traders data every Friday. Inside that report, the "Noncommercial" category — large speculators, managed money, trend-followers — is the one most traders actually want to watch. This script strips everything else away and shows their net stance: Long minus Short, futures contracts only.
Positive values mean large speculators are net long. Negative means net short. A move across zero often marks a meaningful shift in positioning, not just noise.
How it works
The indicator auto-detects the correct CFTC code from the chart's symbol using TradingView's official LibraryCOT, so you don't need to configure anything. Open it on BTC futures, gold, crude oil, the yen — it resolves the code and pulls the right data automatically.
A teal/red histogram shows whether net positioning is positive or negative. A step-line sits on top for precise bar-by-bar reading. Zero is marked with a dashed reference line.
What it doesn't do
It doesn't tell you when to buy or sell. COT data is released weekly and lags several days behind the reporting cutoff — it's positioning context, not a signal. Use it alongside price action and other tools to understand who is leaning which way, not as a standalone trigger.
Notes
Futures only (not futures + options combined)
Noncommercial Long − Noncommercial Short = Net
Data source: CFTC Legacy report via TradingView's LibraryCOT v6
Works on any symbol that has a CFTC code in TradingView's database
Not financial advice. Position sizing and risk management are your responsibility.
Positive values mean large speculators are net long. Negative means net short. A move across zero often marks a meaningful shift in positioning, not just noise.
How it works
The indicator auto-detects the correct CFTC code from the chart's symbol using TradingView's official LibraryCOT, so you don't need to configure anything. Open it on BTC futures, gold, crude oil, the yen — it resolves the code and pulls the right data automatically.
A teal/red histogram shows whether net positioning is positive or negative. A step-line sits on top for precise bar-by-bar reading. Zero is marked with a dashed reference line.
What it doesn't do
It doesn't tell you when to buy or sell. COT data is released weekly and lags several days behind the reporting cutoff — it's positioning context, not a signal. Use it alongside price action and other tools to understand who is leaning which way, not as a standalone trigger.
Notes
Futures only (not futures + options combined)
Noncommercial Long − Noncommercial Short = Net
Data source: CFTC Legacy report via TradingView's LibraryCOT v6
Works on any symbol that has a CFTC code in TradingView's database
Not financial advice. Position sizing and risk management are your responsibility.
开源脚本
秉承TradingView的精神,该脚本的作者将其开源,以便交易者可以查看和验证其功能。向作者致敬!您可以免费使用该脚本,但请记住,重新发布代码须遵守我们的网站规则。

If you've ever wondered why gold and Bitcoin sometimes move with dollar liquidity and sometimes don't, that's basically all I post about here — Fed balance sheet, funding stress, and stablecoin flows, read against price.
免责声明
这些信息和出版物并非旨在提供,也不构成TradingView提供或认可的任何形式的财务、投资、交易或其他类型的建议或推荐。请阅读使用条款了解更多信息。
开源脚本
秉承TradingView的精神,该脚本的作者将其开源,以便交易者可以查看和验证其功能。向作者致敬!您可以免费使用该脚本,但请记住,重新发布代码须遵守我们的网站规则。
If you've ever wondered why gold and Bitcoin sometimes move with dollar liquidity and sometimes don't, that's basically all I post about here — Fed balance sheet, funding stress, and stablecoin flows, read against price.
免责声明
这些信息和出版物并非旨在提供,也不构成TradingView提供或认可的任何形式的财务、投资、交易或其他类型的建议或推荐。请阅读使用条款了解更多信息。