OPEN-SOURCE SCRIPT
Macro Credit Risk
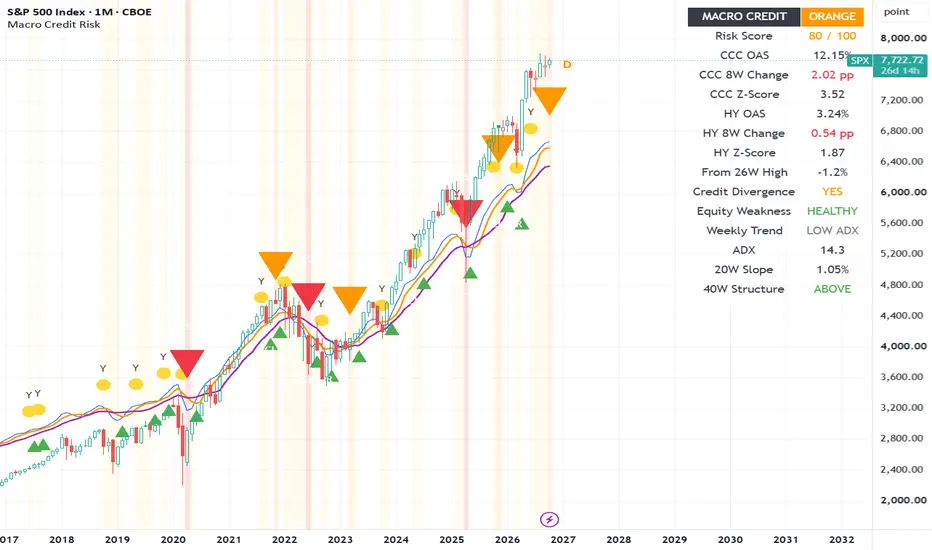
Macro Credit Risk Indicator — User Guide
The Macro Credit Risk indicator is designed to identify when deterioration in lower-quality corporate credit may be warning of rising risk in the equity market.
The core idea is simple:
Credit markets can begin to weaken before the stock market visibly breaks down.
The indicator therefore monitors CCC-rated credit spreads, broad high-yield spreads, and the trend of the equity market to classify the environment into four risk regimes:
GREEN → YELLOW → ORANGE → RED
It is best used as a weekly macro risk-management tool rather than as a mechanical buy or sell system.
What the indicator measures
The indicator combines three main areas of information.
First, it monitors the weakest part of the corporate credit market using CCC-rated and lower high-yield credit spreads.
Second, it checks whether stress is also appearing in the broader high-yield market.
Third, it looks at the equity market to determine whether stocks are still healthy, beginning to weaken, or entering a more established bearish trend.
The main sequence being monitored is:
Credit deteriorates → broad high yield confirms → equities remain near highs → Orange warning → equities weaken → Red confirmation
GREEN — Normal conditions
Green means the indicator does not currently see meaningful deterioration in corporate credit.
This does not mean equities must rise. It simply means the credit market is not currently giving a significant macro warning.
During strong bull markets, the indicator will often remain Green for long periods.
YELLOW — Early credit deterioration
Yellow is the first warning stage.
It means CCC credit spreads have started behaving differently from their recent trend. This may include spreads rising above their trend average, trending upward, or becoming unusually high relative to recent history.
Yellow should be interpreted as:
Credit is beginning to become less comfortable with risk.
It is an early warning, not a sell signal.
Some Yellow signals will disappear without developing into anything serious. That is expected.
ORANGE — Credit and equity divergence
Orange is the most important early macro warning in the indicator.
It means credit conditions have deteriorated significantly while equities are still relatively close to their recent highs.
In simple terms:
Credit is saying risk is increasing, while the stock market still looks healthy.
This disagreement is the credit/equity divergence.
Orange should be interpreted as:
Macro risk is elevated, but equities have not yet confirmed the warning.
This is normally the stage where a user may want to pay closer attention to leverage, position sizing, portfolio concentration, downside risk and overall market exposure.
Orange is not automatically a short signal. Credit can lead equities by weeks or even months.
RED — Credit stress confirmed by equity weakness
Red is deliberately harder to trigger.
The indicator does not move to Red simply because the market has a normal pullback or moves sideways.
For Red to appear, the model looks for a combination of:
Credit stress, equity weakness, bearish directional movement, sufficient trend strength, and a genuinely weakening medium-term equity trend.
Red should be interpreted as:
The warning from credit is now being confirmed by actual deterioration in the stock market trend.
This is much more significant than Orange.
Risk Score
The dashboard includes a Risk Score from 0 to 100.
This combines evidence from CCC spreads, broad high-yield spreads, credit Z-scores, credit/equity divergence, equity drawdown, trend deterioration and structural weakness.
A useful general interpretation is:
0–25: Low macro credit risk
25–45: Credit worth monitoring
45–60: Noticeable deterioration
60–75: Significant macro warning
75–90: High risk
90–100: Severe combined stress
The score is not a probability.
For example, a reading of 80 does not mean there is an 80% chance of a market crash.
It simply means a large number of the warning conditions are currently aligned.
The direction of the score is often as important as the exact number. A score moving from 25 to 35 to 50 to 70 while the S&P 500 is still making new highs can be particularly important.
CCC OAS
CCC OAS shows the current spread for CCC-rated and lower corporate bonds.
Higher spreads mean investors are demanding more compensation to own risky credit.
In general:
Falling CCC spreads suggest improving risk appetite.
Rising CCC spreads suggest deteriorating risk appetite.
The indicator focuses more on the direction and speed of the move than on the absolute level alone.
CCC 8-Week Change
This shows how much CCC spreads have changed over approximately eight weeks.
For example, if the spread was 7.0% eight weeks ago and is now 7.8%, the change is +0.80 percentage points.
A strongly positive reading means risk premiums are widening.
That is generally a negative macro signal.
CCC Z-Score
The CCC Z-Score shows how unusual the current spread is relative to approximately the previous year.
A simple interpretation is:
Below 0: Below recent average
0 to +0.5: Fairly normal
+0.5 to +1.0: Elevated
+1.0 to +1.5: Meaningful stress
+1.5 to +2.0: High stress
Above +2.0: Very unusual stress
A very high Z-score means the current credit spread is far outside its recent normal range.
Broad High-Yield OAS
The broader high-yield spread measures stress across the wider speculative-grade corporate bond market.
CCC credit often reacts first because it represents the weakest borrowers.
Broad high yield helps confirm whether the deterioration is spreading through the wider credit market.
This helps reduce false signals caused by isolated moves in CCC debt.
Broad High-Yield 8-Week Change
This shows how much broad high-yield spreads have changed over approximately eight weeks.
Positive means spreads are widening.
Negative means spreads are narrowing.
If both CCC and broad high-yield spreads are widening together, the warning is more significant.
Broad High-Yield Z-Score
This shows how unusual the broad high-yield spread is relative to its recent history.
A high positive reading means broader credit stress is elevated compared with normal conditions.
From 26-Week High
This shows how far the equity market is below its highest level over approximately the previous six months.
For example, if the recent high was 7,000 and the market is now at 6,790, the drawdown is approximately 3%.
This helps distinguish between:
Credit stress while stocks are still close to their highs
and
Credit stress after stocks have already fallen significantly.
That distinction is important because Orange is designed specifically to identify credit deterioration before the equity market has fully reacted.
Credit Divergence
Credit Divergence shows YES when credit conditions are deteriorating while equities remain near recent highs.
This is one of the most important readings on the dashboard.
A particularly important setup would look like this:
Regime: ORANGE
CCC Z-Score: High
CCC 8-Week Change: Positive
Broad High-Yield Change: Positive
Credit Divergence: YES
Equity Weakness: HEALTHY
That means credit is warning while the equity market still looks strong.
Equity Weakness
The Equity Weakness section describes the condition of the equity trend.
You may see:
HEALTHY
EARLY WEAKNESS
STRONG WEAKNESS
STRUCTURAL WEAKNESS
Healthy means equities have not yet produced meaningful downside confirmation.
Early Weakness means the index has started moving away from its recent high and is weakening relative to its faster weekly trend.
Strong Weakness means the drawdown is larger and the market has deteriorated relative to the medium-term trend.
Structural Weakness means the longer-term market structure is also deteriorating.
Weekly Trend
The Weekly Trend reading is designed to help reduce false Red signals during sideways markets.
It uses trend-strength and directional-movement measures to determine whether the equity market is genuinely trending lower.
Possible readings may include:
LOW ADX
SIDEWAYS / WEAK
TRENDING
BEAR TREND
The purpose is to avoid treating every small pullback as a genuine bearish trend.
ADX
ADX measures trend strength.
It does not tell you whether the trend is bullish or bearish. It tells you whether a meaningful trend exists.
A useful general guide is:
Below 15: Very little trend
15–20: Weak trend
20–25: Moderate trend
Above 25: Strong trend
The indicator uses ADX as one of the filters for Red.
A higher minimum ADX makes Red harder to trigger.
20-Week Slope
The 20-week slope measures whether the medium-term equity trend is genuinely rising or falling.
A slightly falling moving average during a sideways market is not necessarily meaningful.
A more strongly negative slope suggests the medium-term trend itself is deteriorating.
This is one of the main filters used to reduce false Red signals.
40-Week Structure
The 40-week moving average is used as a longer-term structural measure.
It is not the first warning signal.
The indicator is designed to warn earlier through credit deterioration and faster equity confirmation.
The general sequence is:
Credit warning → Orange → early equity deterioration → Red → stronger 20-week deterioration → 40-week structural weakness
The 40-week measure is therefore best viewed as longer-term confirmation.
User Settings
All settings can be adjusted in the indicator settings menu.
The values are hidden from the indicator name on the chart so the chart remains clean.
CCC Trend Length
Default: 13 weeks
This controls the trend average used for CCC spreads.
A shorter setting reacts faster but produces more noise.
A longer setting is smoother but slower.
The default is a good starting point.
CCC Widening Lookback
Default: 8 weeks
This controls how far back the indicator looks when measuring the change in CCC spreads.
A shorter setting, such as 4 weeks, reacts faster to sudden stress but is more sensitive.
A longer setting, such as 12 weeks, is smoother but slower.
Eight weeks is a balanced starting point.
CCC Material Widening
Default: 0.50 percentage points
This means CCC spreads must widen by approximately 50 basis points over the chosen lookback to qualify as a significant move.
Increasing this value creates fewer but stronger warnings.
Lowering it creates earlier warnings but more noise.
Broad High-Yield Trend Length
Default: 13 weeks
This controls the trend average used for the wider high-yield market.
Shorter settings are more responsive.
Longer settings are smoother.
Broad High-Yield Widening Lookback
Default: 8 weeks
This controls how far back the model looks when measuring broader high-yield spread changes.
Broad High-Yield Material Widening
Default: 0.25 percentage points
This determines how much broader high-yield spreads must widen before the move is treated as significant.
A higher value makes the model more conservative.
A lower value makes it more sensitive.
Require Broad High-Yield Confirmation
Default: ON
This is recommended.
When enabled, strong CCC deterioration must also be supported by broader high-yield weakness before the strongest credit warning is accepted.
Turning it off makes the indicator more responsive but may increase false signals.
Z-Score Lookback
Default: 52 weeks
This determines the historical period used to judge whether current credit spreads are unusually high or low.
A 52-week setting compares current conditions with approximately the previous year.
Increasing this to 104 weeks gives a longer-term perspective but reacts more slowly.
Early Stress Z-Score
Default: +0.50
This controls when credit begins to be considered unusually elevated.
Lowering it makes Yellow appear earlier.
Raising it makes the indicator more conservative.
Strong Stress Z-Score
Default: +1.00
This controls when CCC spreads are considered significantly unusual relative to recent history.
Raising it to +1.25 or +1.50 reduces the number of strong credit warnings.
Recent High Lookback
Default: 26 weeks
This determines the period used to calculate the recent equity-market high.
Twenty-six weeks is approximately six months.
Near-High Threshold
Default: 5%
This controls how close equities must be to their recent high for the Orange credit/equity divergence to be considered active.
A lower setting, such as 3%, makes Orange stricter.
A higher setting, such as 7%, allows Orange to remain active during a larger pullback.
Early Equity Weakness
Default: 3%
This helps determine when the equity market begins confirming the credit warning.
Increasing it reduces early equity confirmations.
Lowering it makes the model more sensitive.
Strong Equity Weakness
Default: 5%
This identifies a more significant market correction and provides stronger confirmation that the equity market is deteriorating.
Major Drawdown Override
Default: 8%
This is designed for fast market declines.
Moving averages can react slowly during a sudden sell-off.
The major drawdown override allows the model to recognise serious deterioration even if the slower trend measures have not yet fully rolled over.
Fast Equity Moving Average
Default: 10 weeks
This is used for early equity confirmation.
It reacts relatively quickly.
Medium Equity Moving Average
Default: 20 weeks
This is the main medium-term trend measure.
Its slope is also used to determine whether the equity trend is genuinely turning lower.
Structural Equity Moving Average
Default: 40 weeks
This is used as a longer-term structural trend measure.
It is intentionally slower.
Use Trend-Strength Filter
Default: ON
This should normally remain enabled.
It helps prevent Red signals during flat or choppy markets.
Turning it off makes Red much easier to trigger.
20-Week Slope Lookback
Default: 4 weeks
This determines how far back the indicator looks when measuring the slope of the 20-week moving average.
A longer setting produces a smoother and more structural reading.
A shorter setting reacts faster.
Required 20-Week Slope
Default: -0.40%
This determines how negative the medium-term equity trend must become before it qualifies as meaningful deterioration.
If there are still too many false Red signals during sideways markets, this can be made more negative.
For example:
-0.50%
or
-0.60%
A more negative requirement makes Red harder to trigger.
Minimum Weekly ADX
Default: 18
This controls how strong the equity trend must be before Red can trigger.
If there are too many Red signals during flat markets, this is one of the first settings to increase.
A useful progression is:
18 → 20 → 22
Higher settings reduce false signals but may also make Red appear later.
Require Bearish Directional Movement
Default: ON
This requires bearish directional pressure to be stronger than bullish directional pressure.
It helps distinguish a genuine decline from a volatile sideways market.
This should normally remain enabled.
Red Confirmation Periods
Default: 2
This requires the Red conditions to persist rather than appear only briefly.
Increasing the setting to 3 makes Red more conservative and helps eliminate short-lived false signals.
The trade-off is that the Red signal will arrive later.
Recommended Starting Settings
The default settings are designed to provide a balanced starting point.
A sensible initial configuration is:
CCC trend: 13 weeks
CCC change: 8 weeks
CCC material widening: 0.50 percentage points
Broad high-yield trend: 13 weeks
Broad high-yield change: 8 weeks
Broad high-yield material widening: 0.25 percentage points
Require broad high-yield confirmation: ON
Z-score lookback: 52 weeks
Early stress Z-score: +0.50
Strong stress Z-score: +1.00
Recent equity high lookback: 26 weeks
Near-high threshold: 5%
Early equity weakness: 3%
Strong equity weakness: 5%
Major drawdown override: 8%
Fast equity trend: 10 weeks
Medium equity trend: 20 weeks
Structural equity trend: 40 weeks
Minimum weekly ADX: 18
20-week slope lookback: 4 weeks
Required 20-week slope: -0.40%
Require bearish directional movement: ON
Red confirmation periods: 2
How to Reduce False Red Signals
If historical testing still produces too many Red signals during sideways markets, change only a few settings at a time.
A good order is:
First, increase Minimum Weekly ADX from 18 to 20.
If needed, increase it again to 22.
Second, make the Required 20-Week Slope more negative, for example from -0.40% to -0.50% or -0.60%.
Third, increase Red Confirmation Periods from 2 to 3.
Avoid changing many settings at once because it becomes easy to overfit the indicator to past market crashes.
How to Use the Indicator Each Week
The indicator is best used as a weekly risk-monitoring process.
When the regime is Green, credit conditions are broadly healthy.
When it moves to Yellow, start paying closer attention to CCC spreads and whether deterioration is accelerating.
When it moves to Orange, take the signal seriously. This means credit is warning while equities may still look healthy.
At that stage, watch the Risk Score, Credit Divergence, equity drawdown, ADX, 20-week slope and broader high-yield confirmation.
If the indicator moves to Red, the credit warning is now being confirmed by actual bearish equity behaviour.
If the market also moves below the longer-term structural trend, the warning has become more significant.
The main principle of the indicator is:
Credit warns first. Equities confirm later.
The indicator is designed to help identify that transition while filtering out ordinary sideways market noise.
开源脚本
秉承TradingView的精神,该脚本的作者将其开源,以便交易者可以查看和验证其功能。向作者致敬!您可以免费使用该脚本,但请记住,重新发布代码须遵守我们的网站规则。

免责声明
这些信息和出版物并非旨在提供,也不构成TradingView提供或认可的任何形式的财务、投资、交易或其他类型的建议或推荐。请阅读使用条款了解更多信息。
开源脚本
秉承TradingView的精神,该脚本的作者将其开源,以便交易者可以查看和验证其功能。向作者致敬!您可以免费使用该脚本,但请记住,重新发布代码须遵守我们的网站规则。
免责声明
这些信息和出版物并非旨在提供,也不构成TradingView提供或认可的任何形式的财务、投资、交易或其他类型的建议或推荐。请阅读使用条款了解更多信息。