OPEN-SOURCE SCRIPT
Regime-Filtered RSI Value Zones
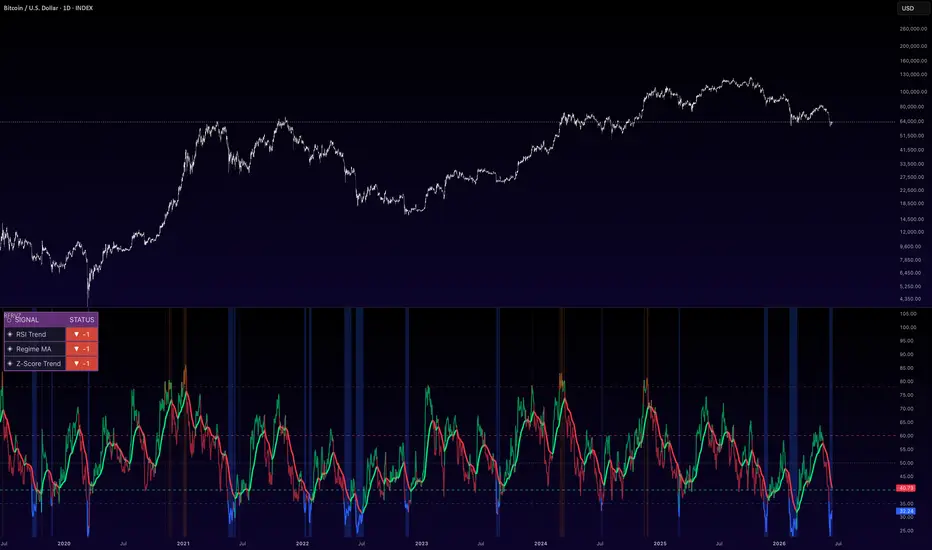
Regime-Filtered RSI Value Zones (RFRVZ)
// A three-layer RSI system combining regime detection, momentum direction
// and Z-score confirmation to identify dynamic DCA buy and sell value zones.
A three-layer RSI-based indicator designed to identify high-probability DCA accumulation and distribution zones on any asset.
How it works:
Layer 1 — RSI Momentum Direction
A user-selectable Moving Average is applied directly to the RSI to identify the current momentum direction. Eight MA types are available including SMA, EMA, HMA, DEMA and TEMA giving full flexibility to tune sensitivity. The MA line plots green when RSI is above it and red when below — providing instant momentum bias at a glance.
Layer 2 — RSI Z-Score
The RSI is normalised against its own recent historical distribution using a Z-Score. This identifies whether current RSI momentum is statistically above or below its recent mean — filtering out weak or noise-driven signals and confirming only statistically meaningful momentum moves.
Layer 3 — DCA Value Zones
Two user-defined RSI threshold levels define the Buy Zone and Sell Zone. When RSI drops into the Buy Zone the panel highlights blue and a single DCA In label fires on entry. When RSI reaches the Sell Zone the panel highlights brown and a DCA Out label fires. Labels are state-managed — one label per zone visit, no repeats until RSI exits and re-enters the zone.
Features:
8 selectable MA types for the RSI smoothing layer
Fully adjustable Buy and Sell Zone thresholds
Adjustable Overbought and Oversold reference levels
Optional Z-Score plot rescaled to RSI scale for direct visual comparison
Toggle for DCA In / Out labels
Clean panel background zone highlighting
// A three-layer RSI system combining regime detection, momentum direction
// and Z-score confirmation to identify dynamic DCA buy and sell value zones.
A three-layer RSI-based indicator designed to identify high-probability DCA accumulation and distribution zones on any asset.
How it works:
Layer 1 — RSI Momentum Direction
A user-selectable Moving Average is applied directly to the RSI to identify the current momentum direction. Eight MA types are available including SMA, EMA, HMA, DEMA and TEMA giving full flexibility to tune sensitivity. The MA line plots green when RSI is above it and red when below — providing instant momentum bias at a glance.
Layer 2 — RSI Z-Score
The RSI is normalised against its own recent historical distribution using a Z-Score. This identifies whether current RSI momentum is statistically above or below its recent mean — filtering out weak or noise-driven signals and confirming only statistically meaningful momentum moves.
Layer 3 — DCA Value Zones
Two user-defined RSI threshold levels define the Buy Zone and Sell Zone. When RSI drops into the Buy Zone the panel highlights blue and a single DCA In label fires on entry. When RSI reaches the Sell Zone the panel highlights brown and a DCA Out label fires. Labels are state-managed — one label per zone visit, no repeats until RSI exits and re-enters the zone.
Features:
8 selectable MA types for the RSI smoothing layer
Fully adjustable Buy and Sell Zone thresholds
Adjustable Overbought and Oversold reference levels
Optional Z-Score plot rescaled to RSI scale for direct visual comparison
Toggle for DCA In / Out labels
Clean panel background zone highlighting
开源脚本
秉承TradingView的精神,该脚本的作者将其开源,以便交易者可以查看和验证其功能。向作者致敬!您可以免费使用该脚本,但请记住,重新发布代码须遵守我们的网站规则。

免责声明
这些信息和出版物并非旨在提供,也不构成TradingView提供或认可的任何形式的财务、投资、交易或其他类型的建议或推荐。请阅读使用条款了解更多信息。
免责声明
这些信息和出版物并非旨在提供,也不构成TradingView提供或认可的任何形式的财务、投资、交易或其他类型的建议或推荐。请阅读使用条款了解更多信息。