OPEN-SOURCE SCRIPT
Change-Point Detection (CUSUM) [LuxAlgo]
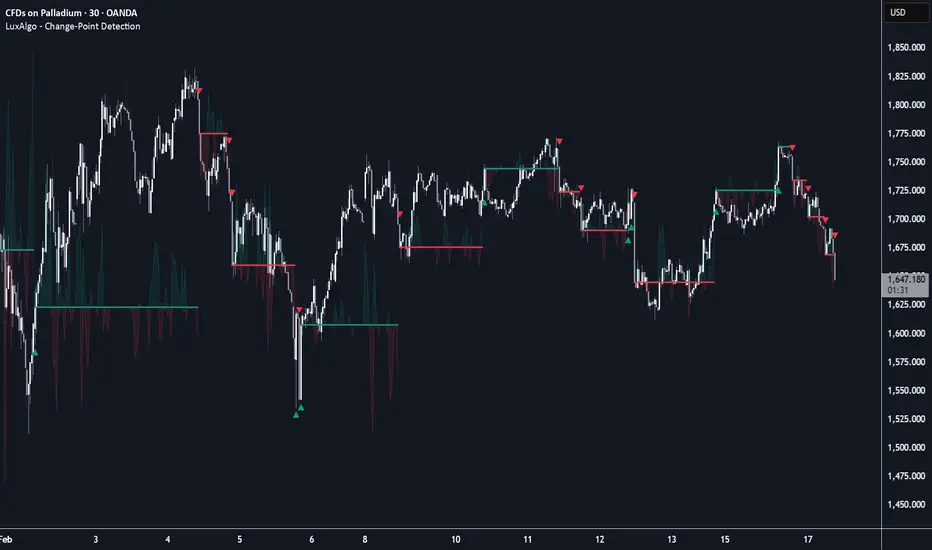
The Change-Point Detection (CUSUM) indicator is a statistical tool designed to detect structural changes in price trends by accumulating deviations from a mean, allowing for the identification of regime shifts before they become obvious to the naked eye.
🔶 USAGE
The indicator helps traders identify when a market has shifted from its current state (bullish or bearish) by monitoring the cumulative sum of standardized log-returns. Unlike standard trend-following indicators that rely on lagging averages, CUSUM looks for a "tipping point" where price behavior significantly deviates from its recent historical norm.
🔹 Interpreting the Visuals
🔶 DETAILS
The script utilizes a modified Cumulative Sum (CUSUM) algorithm, a sequential analysis technique typically used for monitoring change-point detection.
The process follows these steps:
🔶 SETTINGS
🔹 Algorithm Settings
🔹 Dashboard
🔶 USAGE
The indicator helps traders identify when a market has shifted from its current state (bullish or bearish) by monitoring the cumulative sum of standardized log-returns. Unlike standard trend-following indicators that rely on lagging averages, CUSUM looks for a "tipping point" where price behavior significantly deviates from its recent historical norm.
🔹 Interpreting the Visuals
- Regime Line: The solid horizontal/stepping line represents the price level at which the last change-point was detected. The color indicates the current regime (Green for Bullish, Red for Bearish).
- Pressure Bands: The shaded areas extending from the regime line represent the sPos and sNeg accumulators. These visualize how much "pressure" is building up against the current regime.
- Markers: Small triangles appear when the accumulated pressure exceeds the user-defined threshold, signaling a change-point and resetting the baseline to the current price.
🔶 DETAILS
The script utilizes a modified Cumulative Sum (CUSUM) algorithm, a sequential analysis technique typically used for monitoring change-point detection.
The process follows these steps:
- Log-Returns & Standardization: The script calculates the log-returns of the price and standardizes them into a Z-Score based on a rolling mean and standard deviation. This ensures the sensitivity of the algorithm remains consistent regardless of the asset's price or volatility.
- Accumulation: Two accumulators (sPos for upward moves and sNeg for downward moves) track the Z-Score.
- The Slack (k): This parameter acts as a filter. Only deviations greater than k are added to the accumulators. This prevents the indicator from triggering on minor noise or sideways price action.
- The Threshold (h): Once an accumulator exceeds the threshold h, a change-point is confirmed. The accumulators are then reset, and a new regime price is established.
🔶 SETTINGS
🔹 Algorithm Settings
- Lookback Period: Determines the window used to calculate the rolling mean and standard deviation for the standardization of returns.
- Threshold (h): Controls the sensitivity of the detection. A higher threshold requires a more sustained and significant move to trigger a regime change.
- Slack (k): Represents the "allowable" deviation. Increasing this value requires price moves to be more aggressive to begin accumulating toward a change-point.
🔹 Dashboard
- Enable Dashboard: Toggles the visibility of the on-screen information panel.
- Position: Moves the dashboard to different corners of the chart.
- Size: Adjusts the scale of the dashboard text and cells.
开源脚本
秉承TradingView的精神,该脚本的作者将其开源,以便交易者可以查看和验证其功能。向作者致敬!您可以免费使用该脚本,但请记住,重新发布代码须遵守我们的网站规则。

All content & scripts provided by LuxAlgo are for educational purposes only and are not financial advice.
免责声明
这些信息和出版物并非旨在提供,也不构成TradingView提供或认可的任何形式的财务、投资、交易或其他类型的建议或推荐。请阅读使用条款了解更多信息。
开源脚本
秉承TradingView的精神,该脚本的作者将其开源,以便交易者可以查看和验证其功能。向作者致敬!您可以免费使用该脚本,但请记住,重新发布代码须遵守我们的网站规则。
免责声明
这些信息和出版物并非旨在提供,也不构成TradingView提供或认可的任何形式的财务、投资、交易或其他类型的建议或推荐。请阅读使用条款了解更多信息。