OPEN-SOURCE SCRIPT
Volume Terminal [Institutional Edition]
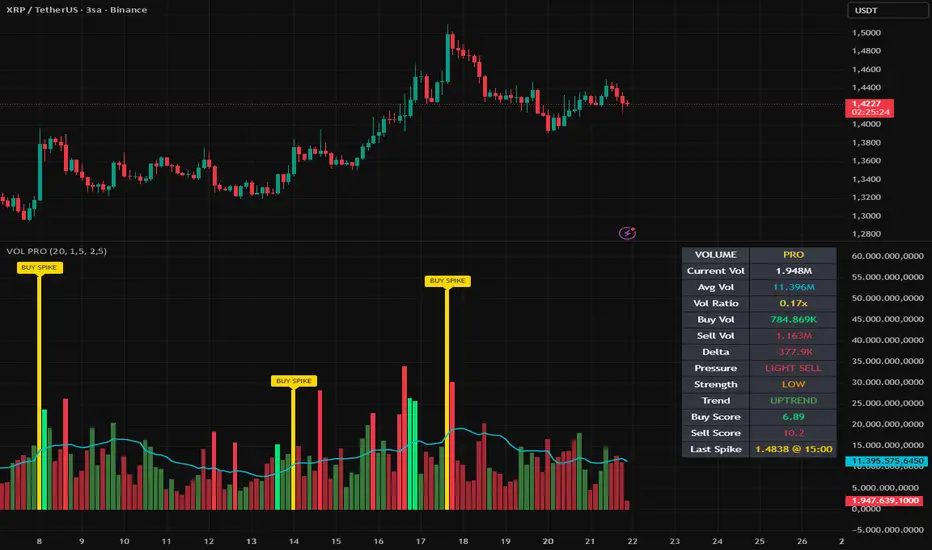
VOLUME TERMINAL PRO is a volume analysis tool designed to help users interpret participation, activity shifts, and relative market interest through a structured dashboard-style interface.
The script focuses on how trading volume changes over time and how unusual increases or decreases may provide additional context to price movement.
Rather than viewing raw volume bars alone, this tool organizes volume behavior into a cleaner workflow that may help users evaluate momentum participation, breakout interest, and quiet market phases.
It is intended for traders who use volume as part of their chart analysis and prefer a more efficient way to monitor market activity across multiple assets and timeframes.
The focus is clarity, structured observation, and practical volume-based chart workflow.
This tool may help users with:
Monitoring rising or falling participation levels
Identifying unusual volume spikes
Supporting breakout confirmation analysis
Detecting low-activity consolidation phases
Comparing current volume vs average activity
Organizing volume data in one interface
Suitable for:
Volume traders
Breakout traders
Swing traders
Intraday traders
Momentum traders
Users seeking cleaner dashboard tools
If structured market activity tools and dashboard-style analysis are part of your workflow, you may also find additional research tools available on this profile useful.
The script focuses on how trading volume changes over time and how unusual increases or decreases may provide additional context to price movement.
Rather than viewing raw volume bars alone, this tool organizes volume behavior into a cleaner workflow that may help users evaluate momentum participation, breakout interest, and quiet market phases.
It is intended for traders who use volume as part of their chart analysis and prefer a more efficient way to monitor market activity across multiple assets and timeframes.
The focus is clarity, structured observation, and practical volume-based chart workflow.
This tool may help users with:
Monitoring rising or falling participation levels
Identifying unusual volume spikes
Supporting breakout confirmation analysis
Detecting low-activity consolidation phases
Comparing current volume vs average activity
Organizing volume data in one interface
Suitable for:
Volume traders
Breakout traders
Swing traders
Intraday traders
Momentum traders
Users seeking cleaner dashboard tools
If structured market activity tools and dashboard-style analysis are part of your workflow, you may also find additional research tools available on this profile useful.
开源脚本
秉承TradingView的精神,该脚本的作者将其开源,以便交易者可以查看和验证其功能。向作者致敬!您可以免费使用该脚本,但请记住,重新发布代码须遵守我们的网站规则。

免责声明
这些信息和出版物并非旨在提供,也不构成TradingView提供或认可的任何形式的财务、投资、交易或其他类型的建议或推荐。请阅读使用条款了解更多信息。
开源脚本
秉承TradingView的精神,该脚本的作者将其开源,以便交易者可以查看和验证其功能。向作者致敬!您可以免费使用该脚本,但请记住,重新发布代码须遵守我们的网站规则。
免责声明
这些信息和出版物并非旨在提供,也不构成TradingView提供或认可的任何形式的财务、投资、交易或其他类型的建议或推荐。请阅读使用条款了解更多信息。