OPEN-SOURCE SCRIPT
已更新 NYSE Open 30s Range
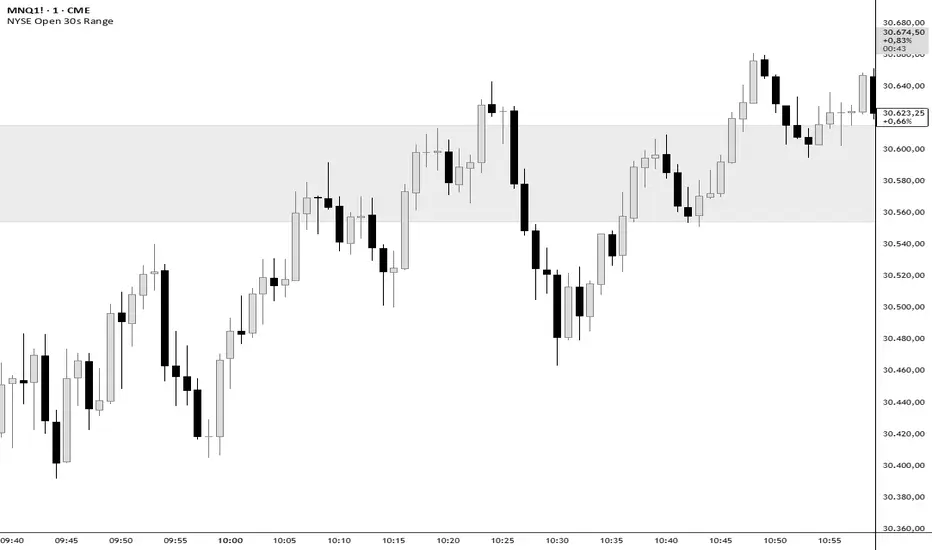
NYSE Opening Range (First 30s Candle)
This indicator automatically plots the NYSE Opening Range based exclusively on the first 30-second candle after the official market open (09:30:00 → 09:30:30 New York time).
The rectangle is drawn using the actual High and Low of that 30-second candle, remaining anchored to the correct opening timestamp regardless of the chart timeframe.
Features
✓ Automatically captures the first 30-second candle of the NYSE open
✓ Rectangle anchored to the actual opening time (does not shift when changing timeframes)
✓ Custom fill color
✓ Adjustable transparency
✓ Custom border color
✓ Multiple border styles (solid, dashed, dotted)
✓ Adjustable border thickness
✓ Adjustable horizontal extension of the range
How to Use
Wait for the first 30-second opening candle to form.
Use the range as a reference for:
Opening breakout setups
Opening rejection setups
Initial market liquidity
Intraday continuation or reversal scenarios
Notes:
The indicator uses internal 30-second data, allowing it to work even on higher chart timeframes.
Time is fixed to America/New_York to maintain alignment with the official NYSE opening session.
This indicator automatically plots the NYSE Opening Range based exclusively on the first 30-second candle after the official market open (09:30:00 → 09:30:30 New York time).
The rectangle is drawn using the actual High and Low of that 30-second candle, remaining anchored to the correct opening timestamp regardless of the chart timeframe.
Features
✓ Automatically captures the first 30-second candle of the NYSE open
✓ Rectangle anchored to the actual opening time (does not shift when changing timeframes)
✓ Custom fill color
✓ Adjustable transparency
✓ Custom border color
✓ Multiple border styles (solid, dashed, dotted)
✓ Adjustable border thickness
✓ Adjustable horizontal extension of the range
How to Use
Wait for the first 30-second opening candle to form.
Use the range as a reference for:
Opening breakout setups
Opening rejection setups
Initial market liquidity
Intraday continuation or reversal scenarios
Notes:
The indicator uses internal 30-second data, allowing it to work even on higher chart timeframes.
Time is fixed to America/New_York to maintain alignment with the official NYSE opening session.
版本注释
Indicator updated to english.开源脚本
秉承TradingView的精神,该脚本的作者将其开源,以便交易者可以查看和验证其功能。向作者致敬!您可以免费使用该脚本,但请记住,重新发布代码须遵守我们的网站规则。

免责声明
这些信息和出版物并非旨在提供,也不构成TradingView提供或认可的任何形式的财务、投资、交易或其他类型的建议或推荐。请阅读使用条款了解更多信息。
免责声明
这些信息和出版物并非旨在提供,也不构成TradingView提供或认可的任何形式的财务、投资、交易或其他类型的建议或推荐。请阅读使用条款了解更多信息。