OPEN-SOURCE SCRIPT
CVD Simple vs Oscillator
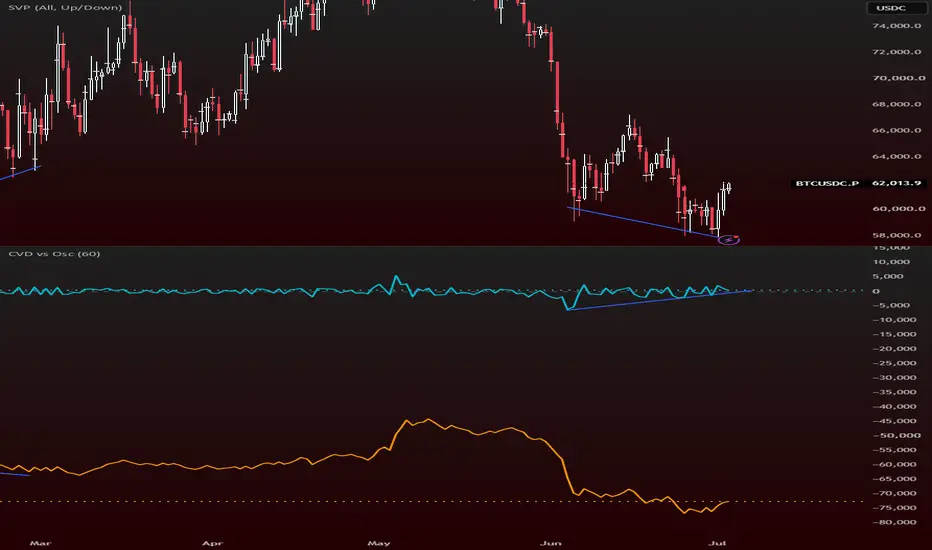
## CVD Simple vs Oscillator
This indicator displays **two versions** of Cumulative Volume Delta side by side for easy comparison:
- **Simple CVD** (Orange): A basic volume delta calculation using close vs open.
- **Oscillator** (Aqua): An advanced, smoother version calculated using intrabar data via TradingView’s `requestVolumeDelta()` function.
### Key Features
- Dual CVD visualization (Simple + Advanced)
- Daily reset by default (resets at the start of each new day)
- Manual vertical scaling enabled (`scale = scale.none`) — drag the right-side scale to stretch the lines
- Clean zero line for easy reference
- Lightweight and easy to read
### How to Use
**Simple CVD (Orange)**
A quick and basic representation of net buying vs selling pressure. It can appear spiky on high-volume bars.
**Oscillator (Aqua)**
A more accurate and smoother representation of cumulative order flow. This is generally the better line to follow for analysis.
### How to Read the Indicator
- **Above zero** → Net buying pressure is dominant
- **Below zero** → Net selling pressure is dominant
- **Rising line** → Buyers are gaining control
- **Falling line** → Sellers are gaining control
### Recommended Usage
- Use the **Oscillator** (Aqua) line for better signals
- Best used on **15m to Daily** timeframes
- Works well for identifying **divergences** between price and volume pressure
- Combine with price action and key support/resistance levels
### Settings
- **Reset Period**: Choose how often the CVD resets (Default = Daily)
- You can manually stretch the vertical scale by dragging the numbers on the right side of the pane
### Notes
This indicator helps traders visualize the ongoing battle between buyers and sellers through cumulative volume delta. The Oscillator version provides a cleaner view compared to basic delta calculations.
This indicator displays **two versions** of Cumulative Volume Delta side by side for easy comparison:
- **Simple CVD** (Orange): A basic volume delta calculation using close vs open.
- **Oscillator** (Aqua): An advanced, smoother version calculated using intrabar data via TradingView’s `requestVolumeDelta()` function.
### Key Features
- Dual CVD visualization (Simple + Advanced)
- Daily reset by default (resets at the start of each new day)
- Manual vertical scaling enabled (`scale = scale.none`) — drag the right-side scale to stretch the lines
- Clean zero line for easy reference
- Lightweight and easy to read
### How to Use
**Simple CVD (Orange)**
A quick and basic representation of net buying vs selling pressure. It can appear spiky on high-volume bars.
**Oscillator (Aqua)**
A more accurate and smoother representation of cumulative order flow. This is generally the better line to follow for analysis.
### How to Read the Indicator
- **Above zero** → Net buying pressure is dominant
- **Below zero** → Net selling pressure is dominant
- **Rising line** → Buyers are gaining control
- **Falling line** → Sellers are gaining control
### Recommended Usage
- Use the **Oscillator** (Aqua) line for better signals
- Best used on **15m to Daily** timeframes
- Works well for identifying **divergences** between price and volume pressure
- Combine with price action and key support/resistance levels
### Settings
- **Reset Period**: Choose how often the CVD resets (Default = Daily)
- You can manually stretch the vertical scale by dragging the numbers on the right side of the pane
### Notes
This indicator helps traders visualize the ongoing battle between buyers and sellers through cumulative volume delta. The Oscillator version provides a cleaner view compared to basic delta calculations.
开源脚本
秉承TradingView的精神,该脚本的作者将其开源,以便交易者可以查看和验证其功能。向作者致敬!您可以免费使用该脚本,但请记住,重新发布代码须遵守我们的网站规则。

免责声明
这些信息和出版物并非旨在提供,也不构成TradingView提供或认可的任何形式的财务、投资、交易或其他类型的建议或推荐。请阅读使用条款了解更多信息。
开源脚本
秉承TradingView的精神,该脚本的作者将其开源,以便交易者可以查看和验证其功能。向作者致敬!您可以免费使用该脚本,但请记住,重新发布代码须遵守我们的网站规则。
免责声明
这些信息和出版物并非旨在提供,也不构成TradingView提供或认可的任何形式的财务、投资、交易或其他类型的建议或推荐。请阅读使用条款了解更多信息。