Volume Footprint, Absorption & Imbalance Analysis by Gurujames
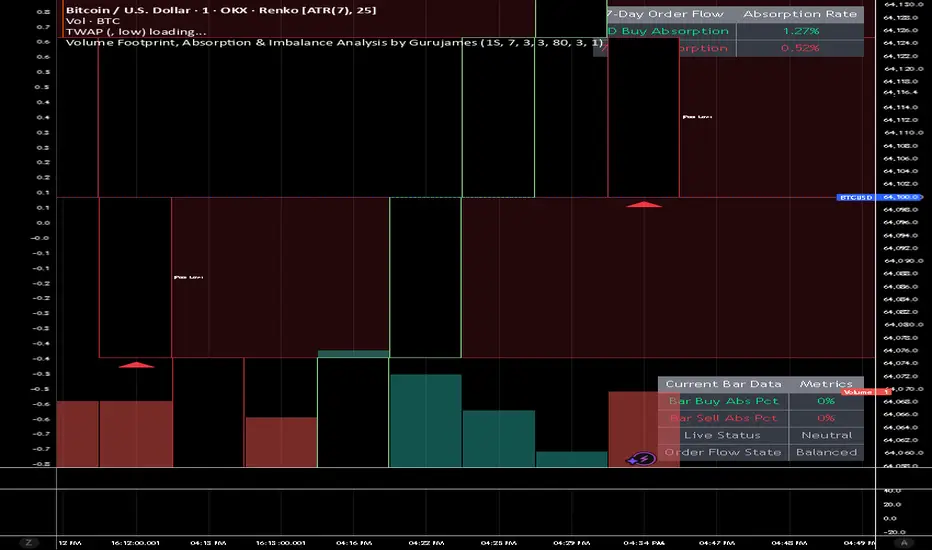
Here is a breakdown of exactly what the tool does and how it helps you analyze the market.
1. Intrabar Order Flow Splitting (Delta Calculation)
Instead of just showing total volume, the script peers into the 1-minute timeframe inside your current candle to calculate the Volume Delta.
What it does: It separates aggressive market buying from aggressive market selling.
Why it matters: It tells you who is actually in control. A candle might close green, but if the delta is heavily negative, it means sellers were aggressively hitting the bid, but buyers held the line.
2. Trapped Trader Detection (Absorption Bubbles)
The script identifies exact moments when aggressive traders get trapped by passive limit orders from larger participants.
What it does: When extreme selling pressure fails to push the price down (leaving a bullish wick), or extreme buying pressure fails to push the price up (leaving a bearish wick), it triggers an absorption event.
Visual Output: It plots a circular bubble above or below the wick. Inside the bubble is the exact percentage of that candle's total volume that was absorbed.
Example: A green bubble reading "72%" means 72% of the bar's volume was aggressive selling that completely failed to move the market down.
3. Institutional Imbalance Zones (Extending Boxes)
This feature finds areas where the market became extremely one-sided, leaving a "vacuum" in the order book.
What it does: It scans for high-volume candles where one side outpaced the other by 300% or more (a 3:1 ratio).
Visual Output: It draws a semi-transparent, extending box (Green for Buy Imbalances, Red for Sell Imbalances) originating from the extreme of the candle.
Why it matters: These areas act as high-probability Supply and Demand zones. Because the move was so aggressive, liquidity was skipped. The market will very often retrace back to these boxes to "mitigate" or fill the skipped orders. The boxes auto-delete after an hour (configurable) to keep your chart clean once they become stale.
4. Unfinished Liquidity Magnets (Missed Auctions / Poor Extremes)
In auction market theory, a healthy market sweeps the high or low until volume tapers off to zero. When it doesn't, it creates a "poor" high or low.
What it does: It detects candles that close at their absolute highest or lowest tick while both buyers and sellers are still actively transacting high volume.
Visual Output: It highlights the upper or lower body of that specific candle with a bright extending box (Green for Missed Buys, Red for Missed Sells), accompanied by a small cross ().X
Why it matters: These zones represent "unfinished business." The market is highly likely to revisit these exact levels later to properly sweep the liquidity that was left hanging. You can toggle these visual zones on or off in the settings.
5. Real-Time Analytics Dashboards
The script paints two distinct data tables on your chart to give you micro and macro perspectives without having to do any math yourself.
The Macro Table (Top Right): Keeps a rolling 7-day memory of market aggressiveness. It shows you the total percentage of volume over the last week that resulted in trapped buyers vs. trapped sellers, helping you gauge the broader structural trend.
The Micro Table (Bottom Right): Acts as a live ticker for the active, moving candlestick. It updates tick-by-tick to show you the current bar's absorption percentages, whether an imbalance has triggered, and explicitly states the structural status (e.g., "BULLISH (Absorbing Sells)" or "Neutral").
1. Intrabar Order Flow Splitting (Delta Calculation)
Instead of just showing total volume, the script peers into the 1-minute timeframe inside your current candle to calculate the Volume Delta.
What it does: It separates aggressive market buying from aggressive market selling.
Why it matters: It tells you who is actually in control. A candle might close green, but if the delta is heavily negative, it means sellers were aggressively hitting the bid, but buyers held the line.
2. Trapped Trader Detection (Absorption Bubbles)
The script identifies exact moments when aggressive traders get trapped by passive limit orders from larger participants.
What it does: When extreme selling pressure fails to push the price down (leaving a bullish wick), or extreme buying pressure fails to push the price up (leaving a bearish wick), it triggers an absorption event.
Visual Output: It plots a circular bubble above or below the wick. Inside the bubble is the exact percentage of that candle's total volume that was absorbed.
Example: A green bubble reading "72%" means 72% of the bar's volume was aggressive selling that completely failed to move the market down.
3. Institutional Imbalance Zones (Extending Boxes)
This feature finds areas where the market became extremely one-sided, leaving a "vacuum" in the order book.
What it does: It scans for high-volume candles where one side outpaced the other by 300% or more (a 3:1 ratio).
Visual Output: It draws a semi-transparent, extending box (Green for Buy Imbalances, Red for Sell Imbalances) originating from the extreme of the candle.
Why it matters: These areas act as high-probability Supply and Demand zones. Because the move was so aggressive, liquidity was skipped. The market will very often retrace back to these boxes to "mitigate" or fill the skipped orders. The boxes auto-delete after an hour (configurable) to keep your chart clean once they become stale.
4. Unfinished Liquidity Magnets (Missed Auctions / Poor Extremes)
In auction market theory, a healthy market sweeps the high or low until volume tapers off to zero. When it doesn't, it creates a "poor" high or low.
What it does: It detects candles that close at their absolute highest or lowest tick while both buyers and sellers are still actively transacting high volume.
Visual Output: It highlights the upper or lower body of that specific candle with a bright extending box (Green for Missed Buys, Red for Missed Sells), accompanied by a small cross ().X
Why it matters: These zones represent "unfinished business." The market is highly likely to revisit these exact levels later to properly sweep the liquidity that was left hanging. You can toggle these visual zones on or off in the settings.
5. Real-Time Analytics Dashboards
The script paints two distinct data tables on your chart to give you micro and macro perspectives without having to do any math yourself.
The Macro Table (Top Right): Keeps a rolling 7-day memory of market aggressiveness. It shows you the total percentage of volume over the last week that resulted in trapped buyers vs. trapped sellers, helping you gauge the broader structural trend.
The Micro Table (Bottom Right): Acts as a live ticker for the active, moving candlestick. It updates tick-by-tick to show you the current bar's absorption percentages, whether an imbalance has triggered, and explicitly states the structural status (e.g., "BULLISH (Absorbing Sells)" or "Neutral").

免责声明
这些信息和出版物并非旨在提供,也不构成TradingView提供或认可的任何形式的财务、投资、交易或其他类型的建议或推荐。请阅读使用条款了解更多信息。
免责声明
这些信息和出版物并非旨在提供,也不构成TradingView提供或认可的任何形式的财务、投资、交易或其他类型的建议或推荐。请阅读使用条款了解更多信息。