已更新
Support Resistance Confluence Zones [AxeAlgo]
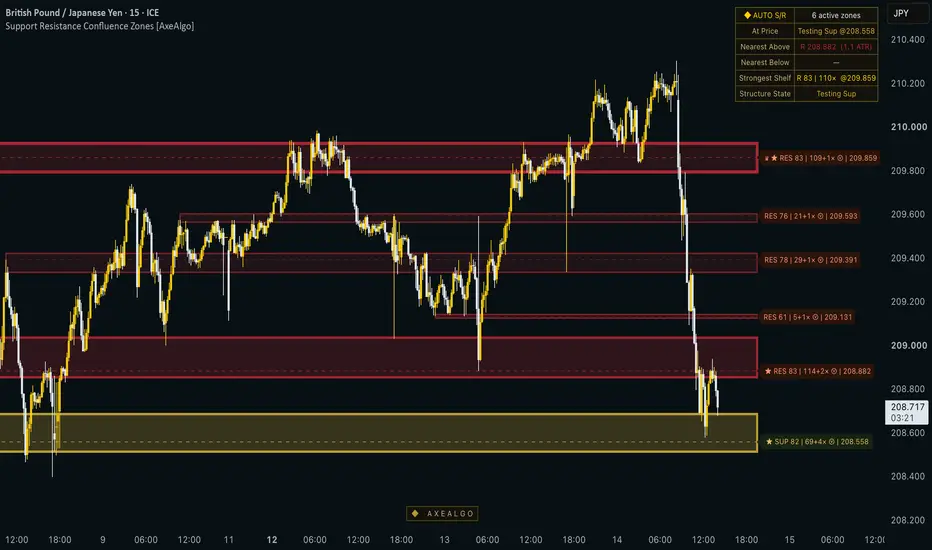
Support Resistance Confluence Zones
--
What it does
This indicator automatically builds support and resistance zones the way a discretionary trader draws them by hand, as a band of price rather than a single thin line, and only after at least two separate swing points agree that the level matters. Instead of plotting every pivot high and low on the chart, it waits for pivots to cluster together within a small ATR based tolerance before drawing a zone, which removes most of the single touch noise that clutters typical support and resistance tools and leaves only levels that price has actually reacted to more than once.
Each zone is scored from 0 to 100 based on four things: how many times price has respected it, whether it aligns with a higher timeframe swing point, whether it sits near a round psychological number, and whether it formed or was retested on unusually high volume. The score is not a simple pass or fail check, it uses a curve that keeps separating heavily tested zones from each other instead of letting every well tested level cap out at the same number, so a zone tested forty times still reads as stronger than one tested ten times. The single highest scoring zone currently visible on the chart is highlighted with a brighter, thicker border and a small marker so the strongest level is identifiable at a glance without needing to read every badge or open a settings panel.
How it works
Pivot highs and lows are detected once they are confirmed a fixed number of bars to the right of the swing, so nothing is plotted based on a pivot that has not actually finished forming. When two pivots on the same side land close enough together, measured as a fraction of the current ATR, they merge into a single zone rather than being drawn as two separate lines. Later pivots that land inside an existing zone extend and reinforce that zone instead of creating a duplicate next to it, and any zones that end up overlapping each other after independently forming are automatically merged into one.
When price closes through a zone, meaning the candle actually closes beyond it rather than just wicking into it, the zone flips role instead of simply disappearing. Broken resistance becomes new support and broken support becomes new resistance, and the indicator keeps a memory of how many times the zone was tested both before and after the flip, shown directly in the badge. Zones that price has since moved far away from fade out visually in stages and are eventually removed once they pass a configurable distance threshold, which keeps the chart focused on levels that are currently relevant rather than accumulating clutter over months of history. A separate de-cluttering setting limits how many resistance levels above price and support levels below price can be displayed at once, always keeping the ones actually nearest to price rather than whichever happened to form first.
An optional dashboard reports the total number of active zones, whether price is currently inside or testing a zone, the nearest zone above price and how many ATR away it is, the nearest zone below price, the single strongest zone on the entire chart with its score, and a plain language read of the overall market structure such as being between support and resistance, above every shelf, or below every shelf.
How to use it
Turn on Auto-Tune to have the pivot detection automatically scale to your chart's timeframe, or turn it off and set the pivot length manually if you want more control. The clustering tolerance, minimum and maximum zone height, and volume threshold all use ATR multiples rather than fixed pixel or point values, so the same default settings behave sensibly whether you are looking at a low priced forex pair or a high priced cryptocurrency. Raise the minimum confluence score to display in order to hide weaker, less established zones and show only the shelves that have proven themselves repeatedly. The higher timeframe alignment boost and the round number boost can each be turned off independently if you would rather see zones scored purely on how often price has reacted to them.
The confluence boosters section lets you decide how much weight to give higher timeframe structure versus simple price reaction. If you trade lower timeframes but want levels that matter on the daily or weekly chart to stand out, keep the higher timeframe boost on. If you would rather see a purely mechanical read of what price itself has done on the current chart, you can turn it off and rely on touch count alone.
This tool is meant to provide structural context for your own analysis and to save you the time of manually marking every level by hand. A high score reflects historical respect for a level, not a prediction that price will react the same way the next time it arrives there, and no zone should be treated as a standalone entry or exit signal.
Alerts
Alerts are provided for a new zone forming, an existing zone being retested, a zone flipping from resistance to support, a zone flipping from support to resistance, and a confirmed rejection off a high confluence zone where price wicks in and closes back outside on the same candle.
Non repainting
Pivots are only plotted once confirmed a fixed number of bars after the swing that created them and never move once drawn. Zone formation, merging, retest counting, breaks, and role flips are all evaluated on confirmed candle closes only, never on an intrabar wick or an unconfirmed pivot. The only elements that update before a bar closes are purely cosmetic, such as a zone's forward extension toward the right edge of the chart and its live distance based fade, neither of which changes the underlying top and bottom of any zone or the score attached to it.
Disclaimer
This script is provided for educational and informational purposes only. It visualizes historical price structure based on past pivots and past reactions, and it does not predict future price movement in any way. Nothing in this indicator constitutes financial advice or a recommendation to buy or sell any instrument. Always use proper risk management and combine this tool with your own independent analysis before making any trading decision.
--
What it does
This indicator automatically builds support and resistance zones the way a discretionary trader draws them by hand, as a band of price rather than a single thin line, and only after at least two separate swing points agree that the level matters. Instead of plotting every pivot high and low on the chart, it waits for pivots to cluster together within a small ATR based tolerance before drawing a zone, which removes most of the single touch noise that clutters typical support and resistance tools and leaves only levels that price has actually reacted to more than once.
Each zone is scored from 0 to 100 based on four things: how many times price has respected it, whether it aligns with a higher timeframe swing point, whether it sits near a round psychological number, and whether it formed or was retested on unusually high volume. The score is not a simple pass or fail check, it uses a curve that keeps separating heavily tested zones from each other instead of letting every well tested level cap out at the same number, so a zone tested forty times still reads as stronger than one tested ten times. The single highest scoring zone currently visible on the chart is highlighted with a brighter, thicker border and a small marker so the strongest level is identifiable at a glance without needing to read every badge or open a settings panel.
How it works
Pivot highs and lows are detected once they are confirmed a fixed number of bars to the right of the swing, so nothing is plotted based on a pivot that has not actually finished forming. When two pivots on the same side land close enough together, measured as a fraction of the current ATR, they merge into a single zone rather than being drawn as two separate lines. Later pivots that land inside an existing zone extend and reinforce that zone instead of creating a duplicate next to it, and any zones that end up overlapping each other after independently forming are automatically merged into one.
When price closes through a zone, meaning the candle actually closes beyond it rather than just wicking into it, the zone flips role instead of simply disappearing. Broken resistance becomes new support and broken support becomes new resistance, and the indicator keeps a memory of how many times the zone was tested both before and after the flip, shown directly in the badge. Zones that price has since moved far away from fade out visually in stages and are eventually removed once they pass a configurable distance threshold, which keeps the chart focused on levels that are currently relevant rather than accumulating clutter over months of history. A separate de-cluttering setting limits how many resistance levels above price and support levels below price can be displayed at once, always keeping the ones actually nearest to price rather than whichever happened to form first.
An optional dashboard reports the total number of active zones, whether price is currently inside or testing a zone, the nearest zone above price and how many ATR away it is, the nearest zone below price, the single strongest zone on the entire chart with its score, and a plain language read of the overall market structure such as being between support and resistance, above every shelf, or below every shelf.
How to use it
Turn on Auto-Tune to have the pivot detection automatically scale to your chart's timeframe, or turn it off and set the pivot length manually if you want more control. The clustering tolerance, minimum and maximum zone height, and volume threshold all use ATR multiples rather than fixed pixel or point values, so the same default settings behave sensibly whether you are looking at a low priced forex pair or a high priced cryptocurrency. Raise the minimum confluence score to display in order to hide weaker, less established zones and show only the shelves that have proven themselves repeatedly. The higher timeframe alignment boost and the round number boost can each be turned off independently if you would rather see zones scored purely on how often price has reacted to them.
The confluence boosters section lets you decide how much weight to give higher timeframe structure versus simple price reaction. If you trade lower timeframes but want levels that matter on the daily or weekly chart to stand out, keep the higher timeframe boost on. If you would rather see a purely mechanical read of what price itself has done on the current chart, you can turn it off and rely on touch count alone.
This tool is meant to provide structural context for your own analysis and to save you the time of manually marking every level by hand. A high score reflects historical respect for a level, not a prediction that price will react the same way the next time it arrives there, and no zone should be treated as a standalone entry or exit signal.
Alerts
Alerts are provided for a new zone forming, an existing zone being retested, a zone flipping from resistance to support, a zone flipping from support to resistance, and a confirmed rejection off a high confluence zone where price wicks in and closes back outside on the same candle.
Non repainting
Pivots are only plotted once confirmed a fixed number of bars after the swing that created them and never move once drawn. Zone formation, merging, retest counting, breaks, and role flips are all evaluated on confirmed candle closes only, never on an intrabar wick or an unconfirmed pivot. The only elements that update before a bar closes are purely cosmetic, such as a zone's forward extension toward the right edge of the chart and its live distance based fade, neither of which changes the underlying top and bottom of any zone or the score attached to it.
Disclaimer
This script is provided for educational and informational purposes only. It visualizes historical price structure based on past pivots and past reactions, and it does not predict future price movement in any way. Nothing in this indicator constitutes financial advice or a recommendation to buy or sell any instrument. Always use proper risk management and combine this tool with your own independent analysis before making any trading decision.
版本注释
- Fixed Colors版本注释
- Fixed Default Inputs版本注释
Fixed - Zone Color Transparency. (from input settings)版本注释
Performance Engine Upgrade & On-Chart Zone Price LevelsThank you to our community for the valuable feedback! This update brings requested usability improvements and resolves lower-timeframe performance limits:
━━━━━━━━━━━━━━━━━━━━━━━━━━━━━━━━━━━━━━━━━━━━━━━━━
1. NEW: Direct On-Chart Price Levels
━━━━━━━━━━━━━━━━━━━━━━━━━━━━━━━━━━━━━━━━━━━━━━━━━
• You can now display exact price levels directly on each support and resistance zone badge.
• Configurable under "2. WHAT TO SHOW":
- Equilibrium (POC/Mid): Displays the high-volume Point of Control or centerline price (e.g. 2,510.50).
- Zone Span (Low — High): Displays the structural boundary span of the shelf (e.g. 2,504.00–2,513.00).
- Both (POC & Span): Combines equilibrium with the full boundary range.
• Works seamlessly with confluence badges or as a standalone clean price tag.
━━━━━━━━━━━━━━━━━━━━━━━━━━━━━━━━━━━━━━━━━━━━━━━━━
2. FIXED: Intraday Historical Buffer Error (5m / 1m Timeframes)
━━━━━━━━━━━━━━━━━━━━━━━━━━━━━━━━━━━━━━━━━━━━━━━━━
• Upgraded core calculation memory to 5,000 bars (max_bars_back = 5000), expanding historical data retention on intraday charts from ~41 hours to over 17 trading days.
• Replaced backward-searching HTF buffer lookups with a zero-buffer persistent state tracking engine, completely eliminating "historical error" / max_bars_back alerts across lower timeframes.
• Added dynamic coordinate safety clamping (f_safeLeft) to protect historical boxes and equilibrium lines from exceeding visible chart drawing buffers.
━━━━━━━━━━━━━━━━━━━━━━━━━━━━━━━━━━━━━━━━━━━━━━━━━
3. DRAWING & RENDERING ENHANCEMENTS
━━━━━━━━━━━━━━━━━━━━━━━━━━━━━━━━━━━━━━━━━━━━━━━━━
• Boosted drawing limits to max capacity (500 boxes, 500 lines, 500 labels) to prevent drawings from disappearing on volatile multi-swing charts.
• Added robust fallbacks for non-standard timeframes (seconds, tick, and exotic intervals).
版本注释
- Fixed Default Inputs
◆ AxeAlgo | axealgo.com
6 years building Pine Script indicators & strategies
6 years building Pine Script indicators & strategies
免责声明
这些信息和出版物并非旨在提供,也不构成TradingView提供或认可的任何形式的财务、投资、交易或其他类型的建议或推荐。请阅读使用条款了解更多信息。
◆ AxeAlgo | axealgo.com
6 years building Pine Script indicators & strategies
6 years building Pine Script indicators & strategies
免责声明
这些信息和出版物并非旨在提供,也不构成TradingView提供或认可的任何形式的财务、投资、交易或其他类型的建议或推荐。请阅读使用条款了解更多信息。