Asian Range (Pre-London)
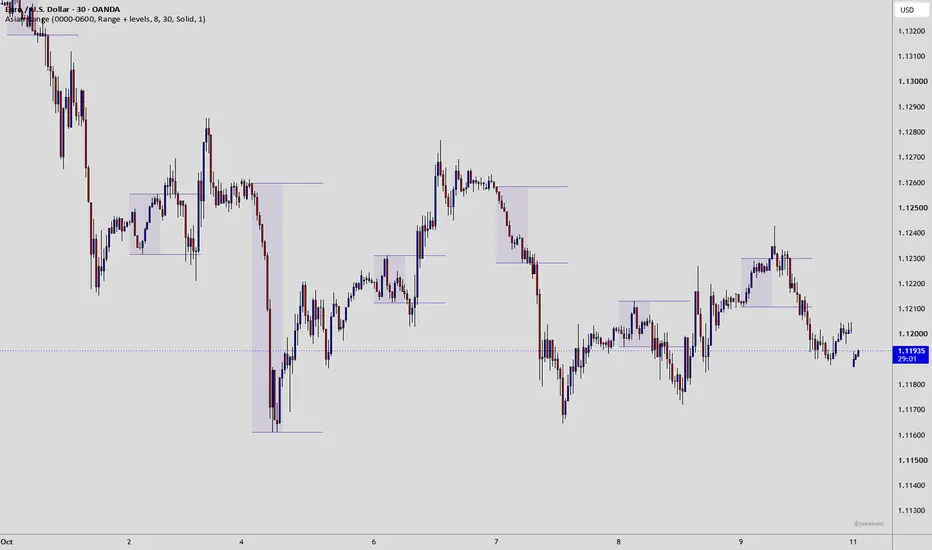
Asian Range (Pre-London) highlights the Asian trading session and marks its high and low, so you can see what the market did overnight before European traders arrive.
It's a clean, informational tool: it draws the range and its levels, and nothing else. No signals, no predictions.
WHAT IS THE ASIAN RANGE?
The Asian range is the high and the low that price makes during Asian trading hours. For EUR and GBP pairs, this is usually the quietest part of the 24-hour forex day. Studies of interbank trading data show that activity and volatility are highest at the market openings and during the London and New York overlap, and much lower for European currencies during Asian hours.
Because the Asian session is often a narrow, quiet range for these pairs, its high and low become clear reference points that many traders watch going into the London session.
WHY 00:00 TO 06:00 LONDON TIME?
There is no single official definition of the Asian session, so the default window is based on how liquidity moves through the day:
- It starts after the day roll. The period around 5pm New York time, when the trading day rolls over, is the least liquid part of the day. Bank pricing systems restart and spreads widen, which can create misleading wicks. Starting at 00:00 London avoids this period.
- It covers the core of Asian trading. Activity picks up at the Tokyo open (09:00 Tokyo time) and around the Tokyo fix (09:55 Tokyo time), a key reference rate where dollar/yen trading volume peaks.
- It ends before Europe arrives. Research shows European trading starts to move the market from around 07:00 London time. Ending at 06:00 keeps the range a clean picture of what happened before European flows begin.
The session is set in London time, so it adjusts automatically when the clocks change. You can change the start and end time in the settings.
WHY TRADERS WATCH THE ASIAN RANGE
- Orders tend to sit beyond obvious levels. Research on currency order flow found that stop-loss orders cluster just beyond round-number price levels. Traders apply the same logic to other highly visible levels, and the Asian high and low are among the most visible of the day. With much higher volume arriving at the London open, these nearby levels are more likely to be tested.
- Two possible outcomes when a level is taken. When price trades through the Asian high or low, it can either sweep the level (take the orders, then close back inside the range and reverse) or break out (the triggered orders add fuel and the move continues). The same research found that moves through clusters of stop-loss orders tend to accelerate, so a breakout is a real possibility, not just a sweep. Many traders watch how price closes after a level is taken to judge which one is unfolding.
- Quiet session, busier sessions ahead. Volatility in European currencies is typically much higher in the London and New York sessions than in Asia, so the quiet Asian range is usually followed by larger moves once Europe opens.
- Daily reference levels. The Asian high and low are commonly used as reference levels for the rest of the trading day, and previous days' Asian highs and lows can remain relevant too.
- Where to avoid trading. Price inside the Asian range is often slow and choppy, so many traders prefer to wait for London to choose a direction.
PAIRS DIFFER
- EUR and GBP pairs: Asia is genuinely quiet for these currencies, so the range usually forms during low activity, before the main European flows arrive.
- JPY, AUD and NZD pairs: Asia is the home session for these currencies, so the range reflects real, active trading rather than a quiet period. Keep this in mind when reading the range on these pairs.
WHAT THIS INDICATOR DOES
- Highlights the Asian session with a shaded range.
- Marks the session high and low with clean horizontal lines.
- Extends the high and low beyond the session, by default for 8 hours (until 14:00 London), covering the London session and the New York open.
- Keeps past days' ranges on the chart, so you can review and backtest how price behaved around them. Levels stay visible even after price trades through them.
- Works on any chart from 1 minute up to 1 hour.
SETTINGS
- Session (London time): start and end of the Asian range. Default 00:00 to 06:00.
- Display: Range + levels (default), Levels only, or Range only.
- Extend levels after session (hours): how long the high and low lines continue after the session ends. Set to 0 to end them with the session.
- Days to show: how many past days are drawn on the chart.
- Show high / low labels: adds "Asia High" and "Asia Low" labels at the end of the lines. Off by default.
- Style: range fill colour, line colour, line style (solid, dashed or dotted) and line width.
ALERTS
Two optional alerts are available in TradingView's alert menu:
- Asian high taken: price trades above the most recent completed Asian high.
- Asian low taken: price trades below the most recent completed Asian low.
NOTES
- The indicator only draws on 1-hour charts and lower. On higher timeframes a short note is shown instead.
- While the session is in progress, the high and low update live. They are final once the session ends.
- This is an analysis tool, not a buy or sell signal. Use it alongside your own analysis and risk management.
It's a clean, informational tool: it draws the range and its levels, and nothing else. No signals, no predictions.
WHAT IS THE ASIAN RANGE?
The Asian range is the high and the low that price makes during Asian trading hours. For EUR and GBP pairs, this is usually the quietest part of the 24-hour forex day. Studies of interbank trading data show that activity and volatility are highest at the market openings and during the London and New York overlap, and much lower for European currencies during Asian hours.
Because the Asian session is often a narrow, quiet range for these pairs, its high and low become clear reference points that many traders watch going into the London session.
WHY 00:00 TO 06:00 LONDON TIME?
There is no single official definition of the Asian session, so the default window is based on how liquidity moves through the day:
- It starts after the day roll. The period around 5pm New York time, when the trading day rolls over, is the least liquid part of the day. Bank pricing systems restart and spreads widen, which can create misleading wicks. Starting at 00:00 London avoids this period.
- It covers the core of Asian trading. Activity picks up at the Tokyo open (09:00 Tokyo time) and around the Tokyo fix (09:55 Tokyo time), a key reference rate where dollar/yen trading volume peaks.
- It ends before Europe arrives. Research shows European trading starts to move the market from around 07:00 London time. Ending at 06:00 keeps the range a clean picture of what happened before European flows begin.
The session is set in London time, so it adjusts automatically when the clocks change. You can change the start and end time in the settings.
WHY TRADERS WATCH THE ASIAN RANGE
- Orders tend to sit beyond obvious levels. Research on currency order flow found that stop-loss orders cluster just beyond round-number price levels. Traders apply the same logic to other highly visible levels, and the Asian high and low are among the most visible of the day. With much higher volume arriving at the London open, these nearby levels are more likely to be tested.
- Two possible outcomes when a level is taken. When price trades through the Asian high or low, it can either sweep the level (take the orders, then close back inside the range and reverse) or break out (the triggered orders add fuel and the move continues). The same research found that moves through clusters of stop-loss orders tend to accelerate, so a breakout is a real possibility, not just a sweep. Many traders watch how price closes after a level is taken to judge which one is unfolding.
- Quiet session, busier sessions ahead. Volatility in European currencies is typically much higher in the London and New York sessions than in Asia, so the quiet Asian range is usually followed by larger moves once Europe opens.
- Daily reference levels. The Asian high and low are commonly used as reference levels for the rest of the trading day, and previous days' Asian highs and lows can remain relevant too.
- Where to avoid trading. Price inside the Asian range is often slow and choppy, so many traders prefer to wait for London to choose a direction.
PAIRS DIFFER
- EUR and GBP pairs: Asia is genuinely quiet for these currencies, so the range usually forms during low activity, before the main European flows arrive.
- JPY, AUD and NZD pairs: Asia is the home session for these currencies, so the range reflects real, active trading rather than a quiet period. Keep this in mind when reading the range on these pairs.
WHAT THIS INDICATOR DOES
- Highlights the Asian session with a shaded range.
- Marks the session high and low with clean horizontal lines.
- Extends the high and low beyond the session, by default for 8 hours (until 14:00 London), covering the London session and the New York open.
- Keeps past days' ranges on the chart, so you can review and backtest how price behaved around them. Levels stay visible even after price trades through them.
- Works on any chart from 1 minute up to 1 hour.
SETTINGS
- Session (London time): start and end of the Asian range. Default 00:00 to 06:00.
- Display: Range + levels (default), Levels only, or Range only.
- Extend levels after session (hours): how long the high and low lines continue after the session ends. Set to 0 to end them with the session.
- Days to show: how many past days are drawn on the chart.
- Show high / low labels: adds "Asia High" and "Asia Low" labels at the end of the lines. Off by default.
- Style: range fill colour, line colour, line style (solid, dashed or dotted) and line width.
ALERTS
Two optional alerts are available in TradingView's alert menu:
- Asian high taken: price trades above the most recent completed Asian high.
- Asian low taken: price trades below the most recent completed Asian low.
NOTES
- The indicator only draws on 1-hour charts and lower. On higher timeframes a short note is shown instead.
- While the session is in progress, the high and low update live. They are final once the session ends.
- This is an analysis tool, not a buy or sell signal. Use it alongside your own analysis and risk management.

免责声明
这些信息和出版物并非旨在提供,也不构成TradingView提供或认可的任何形式的财务、投资、交易或其他类型的建议或推荐。请阅读使用条款了解更多信息。