Wake Up Master
Wake Up Master
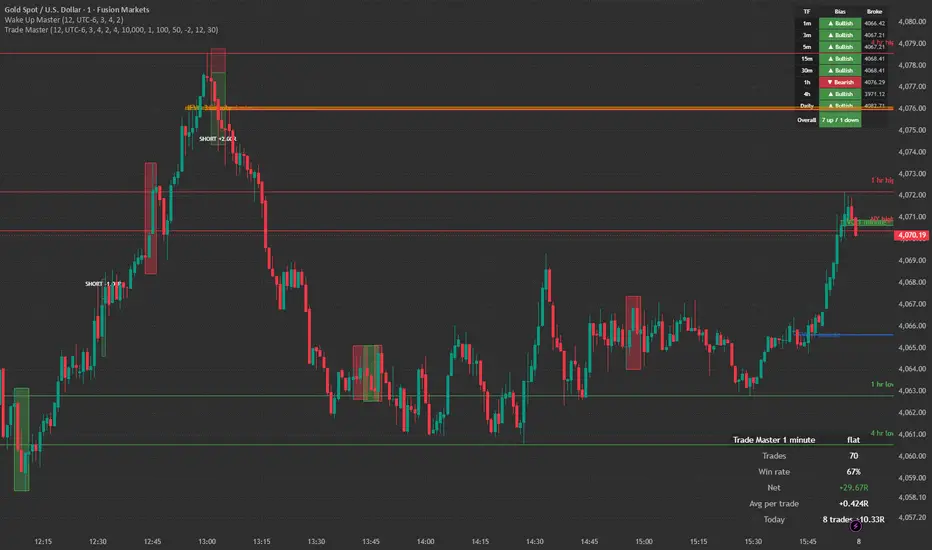
Wake Up Master puts the liquidity map I check before every session on one chart, and keeps it updated in real time: where resting liquidity sits, which of it has already been taken (and when), the nearest fair value gaps and order blocks, and the manipulation legs that swept a swing and broke structure.
WHAT IT DRAWS
1) Liquidity levels (red = highs, green = lows)
- Previous week, previous day, previous 4 hour and previous 1 hour high and low
- Unswept daily highs/lows (2 per side) and unswept weekly highs/lows (1 per side) that price has not traded through yet
- Asian session high/low (00:00-07:00 UTC) and the current session's high/low
- Levels that sit within a small tolerance of each other merge into one ray with a combined label (e.g. "4 hr high / London high"), so the chart stays readable
2) Live sweeps
- A level counts as swept the moment a wick trades through it. There is no waiting for the higher-timeframe candle to close
- A swept level turns dotted and is tagged "SWEPT hh:mm" with the time of the sweep. It is removed 60 candles later
- Sweep times use the "Time zone for sweep times" setting (e.g. UTC, UTC-5, UTC+5:30, America/New_York). Pine cannot read the chart's own time zone, so set it to match the time zone at the bottom right of your chart
3) Fair value gaps and inverse FVGs
- The nearest valid FVG / gap on two timeframes: 15m and 5m on most charts, 3m and 1m on a 1m or 3m chart, and the chart's own timeframe above 15m
- A gap is removed once a candle closes through it
- Inverse FVG (IFVG): when price closes through the far edge of a gap, the gap flips into support (bullish IFVG) or resistance (bearish IFVG). It is removed when price closes back through it
4) Order blocks
- The nearest fresh order blocks per side (5 minute; the chart's own timeframe above 15m)
- Only closed candles are used
5) Manipulation legs
- A leg is a move of up to 4 candles that sweeps the previous swing and then closes beyond the nearest opposite swing formed before the sweep (swing strength = 2 candles each side by default)
- Each leg is boxed (red = bearish, green = bullish) with its projected extension zones at 1.9x the leg's range beyond it
- Optional filter: show only the legs whose zones price reached before the next leg formed
HOW TO USE IT
- Works on any symbol and timeframe. It was built for gold (XAUUSD) on 1m-15m charts, where the session levels and sweeps matter most
- Use it as a map, not a signal: look for price to sweep a level (the label turns "SWEPT") and then react at a nearby FVG, IFVG, order block or leg zone
- Every element has its own on/off switch, colour and font size in the settings, so you can reduce it to just the levels you use
NOTES
- FVGs, order blocks and legs are confirmed on closed candles only. Sweeps are live by design. Drawings do not repaint once confirmed
- The indicator is tied to the candles' price scale, so the drawings move with the chart when you scroll or zoom
- Weekends: while the market is closed, the last completed day / week counts as the previous one
- TradingView limits an indicator to 500 lines, labels and boxes, so only the nearest levels are kept
This indicator is a charting tool for marking liquidity and structure. It does not give buy or sell signals and is not financial advice. Past behaviour of price around these levels does not guarantee future results.
Wake Up Master puts the liquidity map I check before every session on one chart, and keeps it updated in real time: where resting liquidity sits, which of it has already been taken (and when), the nearest fair value gaps and order blocks, and the manipulation legs that swept a swing and broke structure.
WHAT IT DRAWS
1) Liquidity levels (red = highs, green = lows)
- Previous week, previous day, previous 4 hour and previous 1 hour high and low
- Unswept daily highs/lows (2 per side) and unswept weekly highs/lows (1 per side) that price has not traded through yet
- Asian session high/low (00:00-07:00 UTC) and the current session's high/low
- Levels that sit within a small tolerance of each other merge into one ray with a combined label (e.g. "4 hr high / London high"), so the chart stays readable
2) Live sweeps
- A level counts as swept the moment a wick trades through it. There is no waiting for the higher-timeframe candle to close
- A swept level turns dotted and is tagged "SWEPT hh:mm" with the time of the sweep. It is removed 60 candles later
- Sweep times use the "Time zone for sweep times" setting (e.g. UTC, UTC-5, UTC+5:30, America/New_York). Pine cannot read the chart's own time zone, so set it to match the time zone at the bottom right of your chart
3) Fair value gaps and inverse FVGs
- The nearest valid FVG / gap on two timeframes: 15m and 5m on most charts, 3m and 1m on a 1m or 3m chart, and the chart's own timeframe above 15m
- A gap is removed once a candle closes through it
- Inverse FVG (IFVG): when price closes through the far edge of a gap, the gap flips into support (bullish IFVG) or resistance (bearish IFVG). It is removed when price closes back through it
4) Order blocks
- The nearest fresh order blocks per side (5 minute; the chart's own timeframe above 15m)
- Only closed candles are used
5) Manipulation legs
- A leg is a move of up to 4 candles that sweeps the previous swing and then closes beyond the nearest opposite swing formed before the sweep (swing strength = 2 candles each side by default)
- Each leg is boxed (red = bearish, green = bullish) with its projected extension zones at 1.9x the leg's range beyond it
- Optional filter: show only the legs whose zones price reached before the next leg formed
HOW TO USE IT
- Works on any symbol and timeframe. It was built for gold (XAUUSD) on 1m-15m charts, where the session levels and sweeps matter most
- Use it as a map, not a signal: look for price to sweep a level (the label turns "SWEPT") and then react at a nearby FVG, IFVG, order block or leg zone
- Every element has its own on/off switch, colour and font size in the settings, so you can reduce it to just the levels you use
NOTES
- FVGs, order blocks and legs are confirmed on closed candles only. Sweeps are live by design. Drawings do not repaint once confirmed
- The indicator is tied to the candles' price scale, so the drawings move with the chart when you scroll or zoom
- Weekends: while the market is closed, the last completed day / week counts as the previous one
- TradingView limits an indicator to 500 lines, labels and boxes, so only the nearest levels are kept
This indicator is a charting tool for marking liquidity and structure. It does not give buy or sell signals and is not financial advice. Past behaviour of price around these levels does not guarantee future results.

免责声明
这些信息和出版物并非旨在提供,也不构成TradingView提供或认可的任何形式的财务、投资、交易或其他类型的建议或推荐。请阅读使用条款了解更多信息。
免责声明
这些信息和出版物并非旨在提供,也不构成TradingView提供或认可的任何形式的财务、投资、交易或其他类型的建议或推荐。请阅读使用条款了解更多信息。