Stochastic Full Weighted 14-6-14 PRIMUS
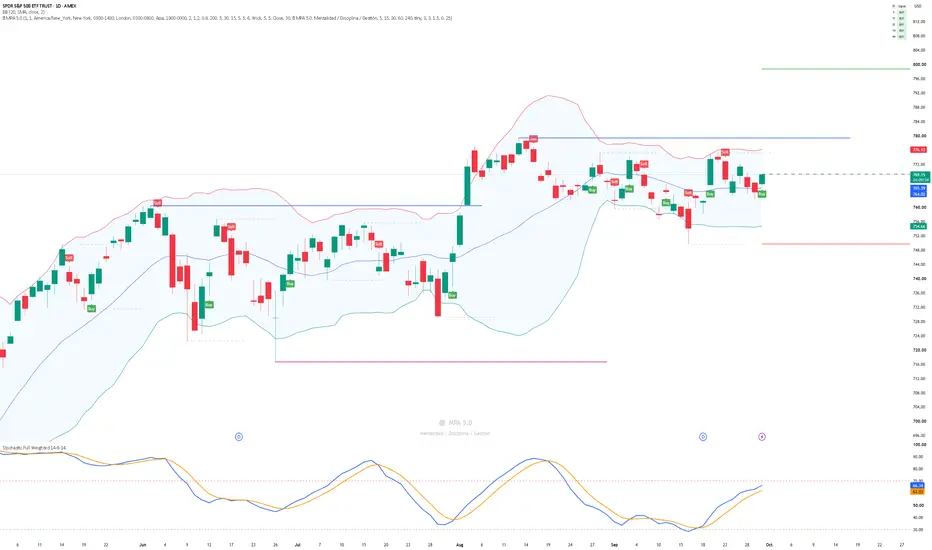
Stochastic Full Weighted 14-6-14
This indicator is a Full Weighted Stochastic Oscillator configured with 14-6-14 settings.
The Full K line, shown in blue, is calculated by smoothing the 14-period Fast Stochastic using a 14-period Weighted Moving Average (WMA). The Full D line, shown in orange, is a 6-period WMA of the Full K line.
Settings:
- Stochastic period: 14
- Full K smoothing: 14-period WMA
- Full D smoothing: 6-period WMA
- Overbought level: 70
- Oversold level: 30
Interpretation:
- A bullish crossover occurs when Full K crosses above Full D and may indicate increasing upward momentum.
- A bearish crossover occurs when Full K crosses below Full D and may indicate increasing downward momentum.
- Bullish crossovers below 30 may help identify potential upward reversals.
- Bearish crossovers above 70 may help identify potential downward reversals.
- Signals should be confirmed using price action, volume, and the overall market trend.
This indicator does not execute trades automatically and is intended for educational and analytical purposes only. It is not financial advice. Always test the indicator thoroughly before using it with real capital.
This indicator is a Full Weighted Stochastic Oscillator configured with 14-6-14 settings.
The Full K line, shown in blue, is calculated by smoothing the 14-period Fast Stochastic using a 14-period Weighted Moving Average (WMA). The Full D line, shown in orange, is a 6-period WMA of the Full K line.
Settings:
- Stochastic period: 14
- Full K smoothing: 14-period WMA
- Full D smoothing: 6-period WMA
- Overbought level: 70
- Oversold level: 30
Interpretation:
- A bullish crossover occurs when Full K crosses above Full D and may indicate increasing upward momentum.
- A bearish crossover occurs when Full K crosses below Full D and may indicate increasing downward momentum.
- Bullish crossovers below 30 may help identify potential upward reversals.
- Bearish crossovers above 70 may help identify potential downward reversals.
- Signals should be confirmed using price action, volume, and the overall market trend.
This indicator does not execute trades automatically and is intended for educational and analytical purposes only. It is not financial advice. Always test the indicator thoroughly before using it with real capital.

免责声明
这些信息和出版物并非旨在提供,也不构成TradingView提供或认可的任何形式的财务、投资、交易或其他类型的建议或推荐。请阅读使用条款了解更多信息。
免责声明
这些信息和出版物并非旨在提供,也不构成TradingView提供或认可的任何形式的财务、投资、交易或其他类型的建议或推荐。请阅读使用条款了解更多信息。