已更新
Blue Dot Red Dot
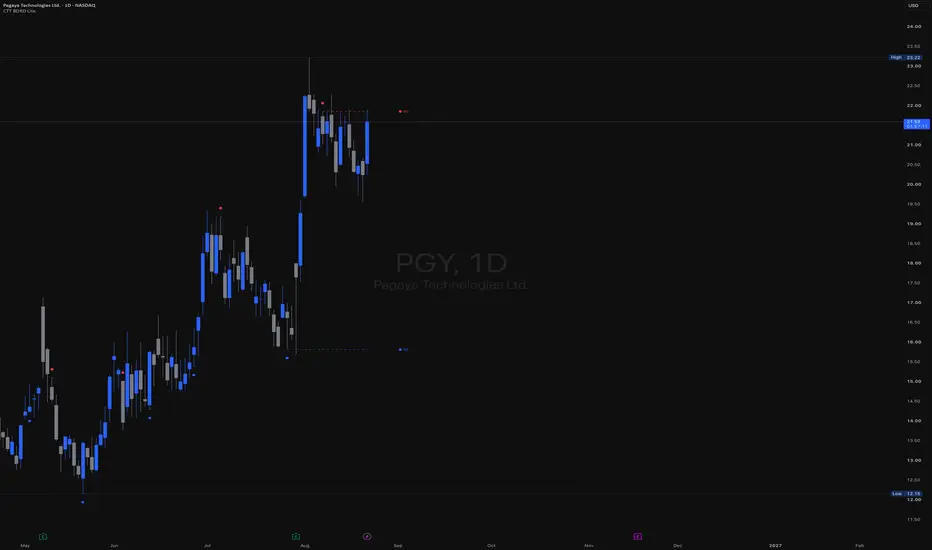
Inspired by Dr Wish
This script is a confluence indicator designed to identify potential trend reversals or "mean reversion" trade setups. It plots buy (blue) and sell (red) dots directly on your price chart.
The core strategy is to find moments where price is overextended (using Bollinger Bands) and momentum is simultaneously reversing (using the Stochastic Oscillator). A signal is only generated when both of these conditions are met.
Core Components
The script combines two classic technical indicators:
Bollinger Bands (BB):
These create a "channel" around the price based on a simple moving average (the basis) and a standard deviation (dev).
Upper Band: Basis + (2.0 * StdDev)
Lower Band: Basis - (2.0 * StdDev)
In this script, the bands are used to identify when the price has moved significantly far from its recent average, suggesting it's "overbought" (at the upper band) or "oversold" (at the lower band) and may be due for a pullback.
Stochastic Oscillator:
This is a momentum oscillator that compares a closing price to its price range over a certain period.
It consists of two lines: %K (the main, faster line) and %D (a moving average of %K, the slower signal line).
It's used to identify overbought and oversold momentum conditions and, more importantly, momentum shifts, which are signaled by the %K and %D lines crossing.
Signal Logic: How the Dots Are Generated
This script's "secret sauce" is that it demands three specific conditions to be true at the same time before plotting a dot.
🔵 Blue Dot (Buy Signal)
A blue dot will appear below a price bar if all three of these conditions are met:
Stochastic Crossover: The faster %K line crosses above the slower %D line (ta.crossover(k, d)). This signals that short-term momentum is starting to turn bullish.
Was Oversold: On the previous bar, the %K line was below the "Oversold Threshold" (was_oversold = k[1] < oversold). This ensures the bullish crossover is happening from an oversold (or at least bearish) momentum state.
Note: The default oversold threshold is set to 50. This is a key detail. It means the script is looking for a bullish crossover that originates from anywhere in the bottom half of the Stochastic range, not just the traditional "extreme" oversold area (like 20).
Price Extension: Within the last 3 bars (the current bar or the two before it), the price's low must have touched or gone below the lower Bollinger Band (bb_touch_lower). This confirms that the price itself is in an "oversold" or overextended area.
In plain English: A blue dot appears when the price has recently dipped to an extreme low (touching the lower BB) and its underlying momentum has just started to turn back up (Stoch cross from the lower half).
🔴 Red Dot (Sell Signal)
A red dot will appear above a price bar if all three of these conditions are met:
Stochastic Crossunder: The faster %K line crosses below the slower %D line (ta.crossunder(k, d)). This signals that short-term momentum is starting to turn bearish.
Was Overbought: On the previous bar, the %K line was above the "Overbought Threshold" (was_overbought = k[1] > overbought). The default for this is 80, which is a traditional overbought level.
Price Extension: Within the last 3 bars (the current bar or the two before it), the price's high must have touched or gone above the upper Bollinger Band (bb_touch_upper). This confirms that the price itself is in an "overbought" or overextended area.
A red dot appears when the price has recently spiked to an extreme high (touching the upper BB) and its underlying momentum has just started to roll over and turn back down (Stoch cross from the overbought zone).
This script is a confluence indicator designed to identify potential trend reversals or "mean reversion" trade setups. It plots buy (blue) and sell (red) dots directly on your price chart.
The core strategy is to find moments where price is overextended (using Bollinger Bands) and momentum is simultaneously reversing (using the Stochastic Oscillator). A signal is only generated when both of these conditions are met.
Core Components
The script combines two classic technical indicators:
Bollinger Bands (BB):
These create a "channel" around the price based on a simple moving average (the basis) and a standard deviation (dev).
Upper Band: Basis + (2.0 * StdDev)
Lower Band: Basis - (2.0 * StdDev)
In this script, the bands are used to identify when the price has moved significantly far from its recent average, suggesting it's "overbought" (at the upper band) or "oversold" (at the lower band) and may be due for a pullback.
Stochastic Oscillator:
This is a momentum oscillator that compares a closing price to its price range over a certain period.
It consists of two lines: %K (the main, faster line) and %D (a moving average of %K, the slower signal line).
It's used to identify overbought and oversold momentum conditions and, more importantly, momentum shifts, which are signaled by the %K and %D lines crossing.
Signal Logic: How the Dots Are Generated
This script's "secret sauce" is that it demands three specific conditions to be true at the same time before plotting a dot.
🔵 Blue Dot (Buy Signal)
A blue dot will appear below a price bar if all three of these conditions are met:
Stochastic Crossover: The faster %K line crosses above the slower %D line (ta.crossover(k, d)). This signals that short-term momentum is starting to turn bullish.
Was Oversold: On the previous bar, the %K line was below the "Oversold Threshold" (was_oversold = k[1] < oversold). This ensures the bullish crossover is happening from an oversold (or at least bearish) momentum state.
Note: The default oversold threshold is set to 50. This is a key detail. It means the script is looking for a bullish crossover that originates from anywhere in the bottom half of the Stochastic range, not just the traditional "extreme" oversold area (like 20).
Price Extension: Within the last 3 bars (the current bar or the two before it), the price's low must have touched or gone below the lower Bollinger Band (bb_touch_lower). This confirms that the price itself is in an "oversold" or overextended area.
In plain English: A blue dot appears when the price has recently dipped to an extreme low (touching the lower BB) and its underlying momentum has just started to turn back up (Stoch cross from the lower half).
🔴 Red Dot (Sell Signal)
A red dot will appear above a price bar if all three of these conditions are met:
Stochastic Crossunder: The faster %K line crosses below the slower %D line (ta.crossunder(k, d)). This signals that short-term momentum is starting to turn bearish.
Was Overbought: On the previous bar, the %K line was above the "Overbought Threshold" (was_overbought = k[1] > overbought). The default for this is 80, which is a traditional overbought level.
Price Extension: Within the last 3 bars (the current bar or the two before it), the price's high must have touched or gone above the upper Bollinger Band (bb_touch_upper). This confirms that the price itself is in an "overbought" or overextended area.
A red dot appears when the price has recently spiked to an extreme high (touching the upper BB) and its underlying momentum has just started to roll over and turn back down (Stoch cross from the overbought zone).
版本注释
Updated the logic and added Blue Dot (BD) and Red Dot (RD) lines to better see support / resistance. Also added Green Line Breakout line (GLB).版本注释
Added a couple filters and also made the Blue dot and Red dot lines dynamic.Added alerts as well.
版本注释
CTT - BDRD Lite V1.0A clean, lightweight support and resistance indicator that identifies key price levels using a Stochastic Bollinger Band crossover system.
WHAT IT DOES
BDRD Lite plots two types of signals directly on your chart:
BD (Buy Dot) — A blue dot appears below the bar when the smoothed Stochastic %K crosses above its lower Bollinger Band, marking a potential support level. A trailing line extends from the signal candle's low.
RD (Red Dot) — A red dot appears above the bar when the smoothed Stochastic %K crosses below its upper Bollinger Band, marking a potential resistance level. A trailing line extends from the signal candle's high.
The trailing BD and RD lines remain on the chart until the next signal fires, giving you a persistent view of the most recent support and resistance levels. Lines change color when price breaks through them — a BD line turns red if price drops below it, and an RD line turns blue if price pushes above it — so you can instantly see whether a level is holding or broken.
HOW IT WORKS
The core engine wraps a Stochastic oscillator inside Bollinger Bands:
1. A smoothed Stochastic %K is calculated using a configurable lookback and smoothing period.
2. Bollinger Bands are applied to that %K line.
3. When %K crosses above the lower band, a BD (buy) signal fires.
4. When %K crosses below the upper band, an RD (sell) signal fires.
This combination filters out noise that a raw Stochastic produces, triggering signals only when momentum moves beyond a statistically significant threshold.
KEY FEATURES
- Works on any symbol and any timeframe — equities, futures, crypto, forex.
- Timeframe Lock — Anchor your BD/RD signals to a specific timeframe (e.g., always calculate from the 15-minute chart regardless of what timeframe you're viewing).
- HTF Stoch Multiplier — Automatically scales the Stochastic and BB lengths on Daily and higher timeframes for smoother, less noisy signals.
- Price Bollinger Bands — Optional overlay that plots Bollinger Bands directly on price for additional context.
- Built-in Alerts — Set alerts for BD and RD signals so you never miss a trigger.
- Full Customization — Colors, line styles, label offsets, and tooltips are all configurable.
HOW TO USE
Add the indicator to your chart. Blue dots below bars mark potential support — consider these as areas of interest for long entries. Red dots above bars mark potential resistance — consider these as areas of interest for short entries or profit targets.
The trailing lines give you a quick read on market structure:
- If the BD line is blue and holding, the most recent support is intact.
- If the BD line has turned red, support has been broken.
- If the RD line is red and holding, resistance is intact.
- If the RD line has turned blue, resistance has been broken.
SETTINGS OVERVIEW
Stochastic Settings — Control the sensitivity of the signal engine. Lower %K Length = more signals, higher = fewer but stronger.
Stoch BB StdDev — Controls how far price must stretch before a signal fires. Higher values = fewer, more extreme signals.
Timeframe Lock — Check this to anchor signals to a fixed timeframe while scrolling through others.
Price Bollinger Bands — Toggle on for an additional price envelope overlay.
---
NOTES
This is the Lite edition. It focuses on the core BD/RD signal engine without multi-timeframe confluence layers.
Signals are generated from historical data and do not repaint. The most recent signal on the current bar may update until the bar closes.
This indicator is a tool for identifying potential support and resistance — it is not financial advice. Always use proper risk management.
Published by Confluence Trading Tools LLC

Confluence Trading Tools LLC — Multi-timeframe trading indicators built for day traders, swing traders, and crypto traders. Request access and learn more at confluencetradingtools.com
免责声明
这些信息和出版物并非旨在提供,也不构成TradingView提供或认可的任何形式的财务、投资、交易或其他类型的建议或推荐。请阅读使用条款了解更多信息。
Confluence Trading Tools LLC — Multi-timeframe trading indicators built for day traders, swing traders, and crypto traders. Request access and learn more at confluencetradingtools.com
免责声明
这些信息和出版物并非旨在提供,也不构成TradingView提供或认可的任何形式的财务、投资、交易或其他类型的建议或推荐。请阅读使用条款了解更多信息。