OPEN-SOURCE SCRIPT
Bitcoin Statistical Forecaster + Power Law [Gabremoku]
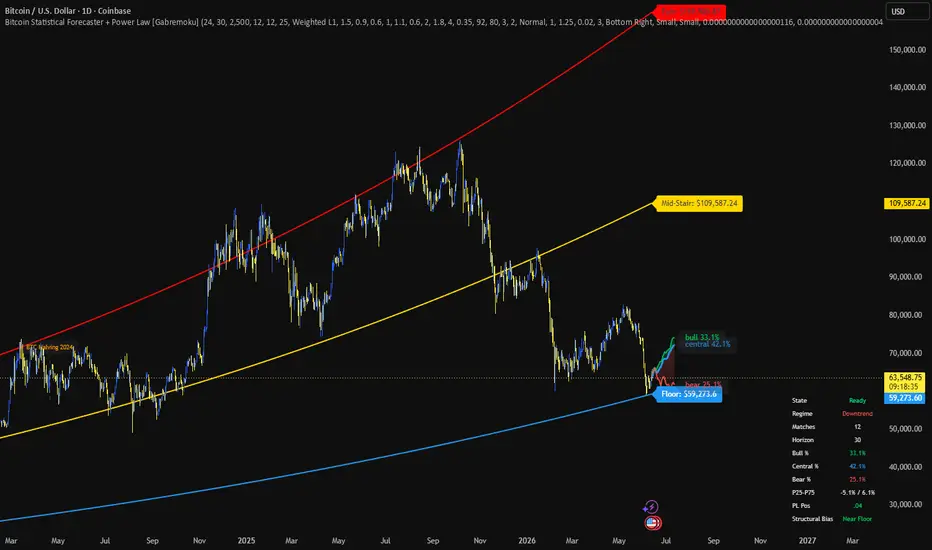
Bitcoin Statistical Forecaster + Power Law combines two analytical layers into a single BTC-focused overlay.
The first layer is a statistical analog forecaster. It scans historical Bitcoin data and searches for the closest matches to the most recent pattern using a weighted multi-feature distance model based on candle structure, volatility, momentum, trend distance, and structural position relative to the Bitcoin power-law range.
The second layer is a long-term Bitcoin power-law framework built from three structural curves: Floor, Mid-Stair, and Fair Value. These curves are plotted directly from the power-law formula and are not altered by the forecasting engine.
The script is not a simple mashup of two unrelated tools. The power-law layer is used as structural context inside the forecaster itself: it contributes to analog selection, regime comparison, optional forecast anchoring, and optional probability adjustment. The goal is to make historical pattern matching more aware of where price is located inside Bitcoin’s broader long-term structure.
How the forecast works:
The script compares the latest pattern against historical BTC windows.
It keeps the best analogs according to the selected similarity method.
These analogs are separated into Bull, Central, and Bear groups using the final return at the selected forecast horizon.
For each step in the projection, each scenario path is built from the weighted average of its own analog group, so the paths remain internally coherent instead of mixing bullish and bearish trajectories.
An optional structural bias can softly pull projected prices toward the power-law range over time. This effect fades in progressively across the forecast horizon, so near-term projections are not abruptly distorted.
Scenario probabilities are derived from the same percentile thresholds used to build the Bull, Central, and Bear paths. This keeps the displayed percentages aligned with the projected paths shown on the chart.
The script is designed for daily Bitcoin charts and works best when enough historical data is available. It is a probabilistic context tool, not a prediction guarantee, and it should be used together with risk management and independent market analysis.
Suggested usage:
Use the power-law curves to identify long-term structural position.
Use the forecast paths to estimate how similar historical BTC conditions evolved.
Compare current price location, structural regime, and scenario probabilities before forming a directional bias.
Treat the output as a contextual model, not as a standalone trading signal.
The first layer is a statistical analog forecaster. It scans historical Bitcoin data and searches for the closest matches to the most recent pattern using a weighted multi-feature distance model based on candle structure, volatility, momentum, trend distance, and structural position relative to the Bitcoin power-law range.
The second layer is a long-term Bitcoin power-law framework built from three structural curves: Floor, Mid-Stair, and Fair Value. These curves are plotted directly from the power-law formula and are not altered by the forecasting engine.
The script is not a simple mashup of two unrelated tools. The power-law layer is used as structural context inside the forecaster itself: it contributes to analog selection, regime comparison, optional forecast anchoring, and optional probability adjustment. The goal is to make historical pattern matching more aware of where price is located inside Bitcoin’s broader long-term structure.
How the forecast works:
The script compares the latest pattern against historical BTC windows.
It keeps the best analogs according to the selected similarity method.
These analogs are separated into Bull, Central, and Bear groups using the final return at the selected forecast horizon.
For each step in the projection, each scenario path is built from the weighted average of its own analog group, so the paths remain internally coherent instead of mixing bullish and bearish trajectories.
An optional structural bias can softly pull projected prices toward the power-law range over time. This effect fades in progressively across the forecast horizon, so near-term projections are not abruptly distorted.
Scenario probabilities are derived from the same percentile thresholds used to build the Bull, Central, and Bear paths. This keeps the displayed percentages aligned with the projected paths shown on the chart.
The script is designed for daily Bitcoin charts and works best when enough historical data is available. It is a probabilistic context tool, not a prediction guarantee, and it should be used together with risk management and independent market analysis.
Suggested usage:
Use the power-law curves to identify long-term structural position.
Use the forecast paths to estimate how similar historical BTC conditions evolved.
Compare current price location, structural regime, and scenario probabilities before forming a directional bias.
Treat the output as a contextual model, not as a standalone trading signal.
开源脚本
秉承TradingView的精神,该脚本的作者将其开源,以便交易者可以查看和验证其功能。向作者致敬!您可以免费使用该脚本,但请记住,重新发布代码须遵守我们的网站规则。

免责声明
这些信息和出版物并非旨在提供,也不构成TradingView提供或认可的任何形式的财务、投资、交易或其他类型的建议或推荐。请阅读使用条款了解更多信息。
免责声明
这些信息和出版物并非旨在提供,也不构成TradingView提供或认可的任何形式的财务、投资、交易或其他类型的建议或推荐。请阅读使用条款了解更多信息。