已更新
VWAP Surge Pilot
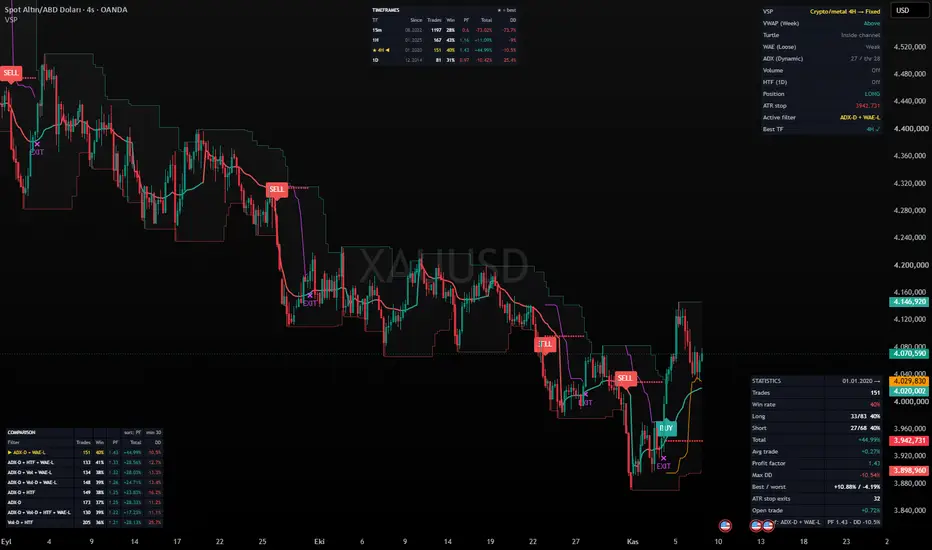
VWAP Surge Pilot (VSP)
A breakout trend-following tool that combines three classic ideas, VWAP, Turtle channel breakouts and Waddah Attar Explosion momentum, and adds a built-in back-test engine that compares filter combinations and timeframes for you.
Everything runs inside one indicator, so it works on the free TradingView plan.
HOW SIGNALS ARE BUILT
A BUY signal needs all three core conditions:
1. VWAP direction: price closes above VWAP (below for SELL).
VWAP resets automatically by timeframe: Day on 1H and below, Week on 2H-4H, Month on 6H-1D, Year above that.
2. Turtle channel breakout: price breaks the highest high of the last 20 bars (lowest low for SELL).
The other confirmations may arrive within a few bars after the breakout ("Breakout validity").
3. WAE momentum confirmation: the Waddah Attar Explosion bar has the right color and
- Strict mode: is above the explosion line, or
- Loose mode: is larger than the previous bar.
A dead-zone filter ignores momentum that is too small relative to ATR.
Exits:
- EXIT: price closes beyond the opposite side of the 10-bar exit channel (classic Turtle trailing stop).
- STOP: an optional fixed ATR stop (default 2.5 × ATR) placed at entry. Whichever comes first closes the trade.
- An opposite signal flips the position.
Signals are confirmed on bar close by default, so they do not repaint.
OPTIONAL FILTERS
- Dynamic ADX: ADX must be above its own median of the last 100 bars (with a floor) AND rising, and DI direction must match the signal. The threshold adapts to each asset instead of using a fixed 20/25.
- Volume (Fixed or Dynamic): relative volume spike near the breakout. In Dynamic mode the threshold is a percentile of the asset's own recent relative volume, and the spike candle must point in the signal direction.
- Higher timeframe trend: longs only above, shorts only below a higher-timeframe EMA. The higher timeframe is chosen automatically from the chart timeframe.
- Trade direction: Both / Long only / Short only, for assets with a one-sided long-term trend.
AUTOPILOT
In the background, VSP back-tests all 24 filter combinations (ADX off/dynamic × Volume off/fixed/dynamic × HTF on/off × WAE strict/loose) at the same time, and trades with the combination that has performed best so far.
- Selection uses only trades that have already closed. There is no look-ahead.
- A combination needs a minimum number of trades (default 30) before it can be chosen.
- A switch threshold (default 10%) prevents jumping between combinations that are practically equal.
- The metric can be Profit factor or Return / Drawdown.
Manual mode is available if you prefer to pick the filters yourself.
Note: the Statistics panel shows the Autopilot's real walk-forward result. The top row of the Comparison table shows the best combination in hindsight, so it will usually look better than what the Autopilot actually achieved.
PANELS
- Status table: live state of every condition, current position, ATR stop level, active filter combination and the recommended timeframe.
- Statistics: trades, win rate (long/short separately), compounded total return, average trade, profit factor, max drawdown, best/worst trade, ATR stop exits and the open trade.
- Comparison: all 24 filter combinations side by side, sorted by the Autopilot metric. ▶ marks the active one.
- Timeframes: the whole system (Autopilot included) is also run on 15m, 1H, 4H and 1D. ★ marks the timeframe with the best result. The status table warns when the chart is not on it.
HOW THE STATISTICS ARE CALCULATED
- Commission is deducted twice per trade (entry + exit). Default 0.05% one way.
- Total return and max drawdown are compounded. Max DD is the largest fall from an equity peak, so it can never exceed 100%.
- "Position size (% of balance)" scales Total and Max DD. 100 = full balance per trade. Values above 100 simulate leverage (300 = 3x). Use it to see what drawdown your own position size or leverage would have produced.
- Lower timeframes in the Timeframes table load data only from the chart's first visible bar, so their results depend on the open chart. Check the "Since" column.
- The free plan loads a limited number of bars, which limits how far back the tests go.
AUTHOR'S OBSERVATIONS
These are observations from the author's own historical tests, not a promise of future results:
- The most stable results came from gold (XAUUSD and gold in TRY) on 1H and 4H.
- 15m was not profitable on any tested asset once commission was included. The moves are too small and too noisy for a breakout system.
- Highly volatile assets (crypto, silver in 2026) produced very deep drawdowns even when the total return was positive.
- On assets with a strong long-term uptrend, short trades had a much lower win rate. "Long only" may be worth testing there.
Always check the Timeframes and Comparison tables on your own symbol before relying on any signal.
ALERTS
BUY, SELL, Long Exit and Short Exit (including ATR stop exits).
CREDITS
- Waddah Attar Explosion: original concept by Waddah Attar. The TradingView version this tool's WAE logic is based on is the [SHK] adaptation by Shayankm, building on LazyBear's port.
- Turtle channel breakout rules: based on the Turtle Trading system of Richard Dennis and William Eckhardt.
- VWAP: standard volume-weighted average price, using TradingView's built-in ta.vwap.
DISCLAIMER
This script is for educational and research purposes only. It is not financial advice. Historical back-test results do not guarantee future performance. The statistics are simulations based on bar data and do not include slippage, funding fees or execution delays. Trading with leverage can result in the loss of your entire balance.
A breakout trend-following tool that combines three classic ideas, VWAP, Turtle channel breakouts and Waddah Attar Explosion momentum, and adds a built-in back-test engine that compares filter combinations and timeframes for you.
Everything runs inside one indicator, so it works on the free TradingView plan.
HOW SIGNALS ARE BUILT
A BUY signal needs all three core conditions:
1. VWAP direction: price closes above VWAP (below for SELL).
VWAP resets automatically by timeframe: Day on 1H and below, Week on 2H-4H, Month on 6H-1D, Year above that.
2. Turtle channel breakout: price breaks the highest high of the last 20 bars (lowest low for SELL).
The other confirmations may arrive within a few bars after the breakout ("Breakout validity").
3. WAE momentum confirmation: the Waddah Attar Explosion bar has the right color and
- Strict mode: is above the explosion line, or
- Loose mode: is larger than the previous bar.
A dead-zone filter ignores momentum that is too small relative to ATR.
Exits:
- EXIT: price closes beyond the opposite side of the 10-bar exit channel (classic Turtle trailing stop).
- STOP: an optional fixed ATR stop (default 2.5 × ATR) placed at entry. Whichever comes first closes the trade.
- An opposite signal flips the position.
Signals are confirmed on bar close by default, so they do not repaint.
OPTIONAL FILTERS
- Dynamic ADX: ADX must be above its own median of the last 100 bars (with a floor) AND rising, and DI direction must match the signal. The threshold adapts to each asset instead of using a fixed 20/25.
- Volume (Fixed or Dynamic): relative volume spike near the breakout. In Dynamic mode the threshold is a percentile of the asset's own recent relative volume, and the spike candle must point in the signal direction.
- Higher timeframe trend: longs only above, shorts only below a higher-timeframe EMA. The higher timeframe is chosen automatically from the chart timeframe.
- Trade direction: Both / Long only / Short only, for assets with a one-sided long-term trend.
AUTOPILOT
In the background, VSP back-tests all 24 filter combinations (ADX off/dynamic × Volume off/fixed/dynamic × HTF on/off × WAE strict/loose) at the same time, and trades with the combination that has performed best so far.
- Selection uses only trades that have already closed. There is no look-ahead.
- A combination needs a minimum number of trades (default 30) before it can be chosen.
- A switch threshold (default 10%) prevents jumping between combinations that are practically equal.
- The metric can be Profit factor or Return / Drawdown.
Manual mode is available if you prefer to pick the filters yourself.
Note: the Statistics panel shows the Autopilot's real walk-forward result. The top row of the Comparison table shows the best combination in hindsight, so it will usually look better than what the Autopilot actually achieved.
PANELS
- Status table: live state of every condition, current position, ATR stop level, active filter combination and the recommended timeframe.
- Statistics: trades, win rate (long/short separately), compounded total return, average trade, profit factor, max drawdown, best/worst trade, ATR stop exits and the open trade.
- Comparison: all 24 filter combinations side by side, sorted by the Autopilot metric. ▶ marks the active one.
- Timeframes: the whole system (Autopilot included) is also run on 15m, 1H, 4H and 1D. ★ marks the timeframe with the best result. The status table warns when the chart is not on it.
HOW THE STATISTICS ARE CALCULATED
- Commission is deducted twice per trade (entry + exit). Default 0.05% one way.
- Total return and max drawdown are compounded. Max DD is the largest fall from an equity peak, so it can never exceed 100%.
- "Position size (% of balance)" scales Total and Max DD. 100 = full balance per trade. Values above 100 simulate leverage (300 = 3x). Use it to see what drawdown your own position size or leverage would have produced.
- Lower timeframes in the Timeframes table load data only from the chart's first visible bar, so their results depend on the open chart. Check the "Since" column.
- The free plan loads a limited number of bars, which limits how far back the tests go.
AUTHOR'S OBSERVATIONS
These are observations from the author's own historical tests, not a promise of future results:
- The most stable results came from gold (XAUUSD and gold in TRY) on 1H and 4H.
- 15m was not profitable on any tested asset once commission was included. The moves are too small and too noisy for a breakout system.
- Highly volatile assets (crypto, silver in 2026) produced very deep drawdowns even when the total return was positive.
- On assets with a strong long-term uptrend, short trades had a much lower win rate. "Long only" may be worth testing there.
Always check the Timeframes and Comparison tables on your own symbol before relying on any signal.
ALERTS
BUY, SELL, Long Exit and Short Exit (including ATR stop exits).
CREDITS
- Waddah Attar Explosion: original concept by Waddah Attar. The TradingView version this tool's WAE logic is based on is the [SHK] adaptation by Shayankm, building on LazyBear's port.
- Turtle channel breakout rules: based on the Turtle Trading system of Richard Dennis and William Eckhardt.
- VWAP: standard volume-weighted average price, using TradingView's built-in ta.vwap.
DISCLAIMER
This script is for educational and research purposes only. It is not financial advice. Historical back-test results do not guarantee future performance. The statistics are simulations based on bar data and do not include slippage, funding fees or execution delays. Trading with leverage can result in the loss of your entire balance.
版本注释
- Statistics header now shows the position size when it is not 100%, so screenshots make clear whether results are leveraged.- Chart updated to XAUUSD 4H to match the author's observations.
版本注释
VWAP Surge Pilot (VSP)A breakout trend-following tool that combines three classic ideas, VWAP, Turtle channel breakouts and Waddah Attar Explosion momentum, and adds a built-in back-test engine that compares filter combinations and timeframes for you.
Everything runs inside one indicator, so it works on the free TradingView plan.
HOW SIGNALS ARE BUILT
A BUY signal needs all three core conditions:
1. VWAP direction: price closes above VWAP (below for SELL).
VWAP resets automatically by timeframe: Day on 1H and below, Week on 2H-4H, Month on 6H-1D, Year above that.
2. Turtle channel breakout: price breaks the highest high of the last 20 bars (lowest low for SELL).
The other confirmations may arrive within a few bars after the breakout ("Breakout validity").
3. WAE momentum confirmation: the Waddah Attar Explosion bar has the right color and
- Strict mode: is above the explosion line, or
- Loose mode: is larger than the previous bar.
A dead-zone filter ignores momentum that is too small relative to ATR.
Exits:
- EXIT: price closes beyond the opposite side of the 10-bar exit channel (classic Turtle trailing stop).
- STOP: an optional fixed ATR stop (default 2.5 × ATR) placed at entry. Whichever comes first closes the trade.
- An opposite signal flips the position.
Signals are confirmed on bar close by default, so they do not repaint.
OPTIONAL FILTERS
- Dynamic ADX: ADX must be above its own median of the last 100 bars (with a floor) AND rising, and DI direction must match the signal. The threshold adapts to each asset instead of using a fixed 20/25.
- Volume (Fixed or Dynamic): relative volume spike near the breakout. In Dynamic mode the threshold is a percentile of the asset's own recent relative volume, and the spike candle must point in the signal direction.
- Higher timeframe trend: longs only above, shorts only below a higher-timeframe EMA. The higher timeframe is chosen automatically from the chart timeframe.
- Trade direction: Both / Long only / Short only, for assets with a one-sided long-term trend.
AUTOPILOT
In the background, VSP back-tests all 24 filter combinations (ADX off/dynamic × Volume off/fixed/dynamic × HTF on/off × WAE strict/loose) at the same time, and trades with the combination that has performed best so far.
- Selection uses only trades that have already closed. There is no look-ahead.
- A combination needs a minimum number of trades (default 30) before it can be chosen.
- A switch threshold (default 10%) prevents jumping between combinations that are practically equal.
- The metric can be Profit factor or Return / Drawdown.
Manual mode is available if you prefer to pick the filters yourself.
Note: the Statistics panel shows the Autopilot's real walk-forward result. The top row of the Comparison table shows the best combination in hindsight, so it will usually look better than what the Autopilot actually achieved.
PANELS
- Status table: live state of every condition, current position, ATR stop level, active filter combination and the recommended timeframe.
- Statistics: trades, win rate (long/short separately), compounded total return, average trade, profit factor, max drawdown, best/worst trade, ATR stop exits and the open trade.
- Comparison: all 24 filter combinations side by side, sorted by the Autopilot metric. ▶ marks the active one.
- Timeframes: the whole system (Autopilot included) is also run on 15m, 1H, 4H and 1D. ★ marks the timeframe with the best result. The status table warns when the chart is not on it.
HOW THE STATISTICS ARE CALCULATED
- Commission is deducted twice per trade (entry + exit). Default 0.05% one way.
- Slippage is deducted the same way to account for worse fills on breakouts and stops. Default 0.02% one way.
- Total return and max drawdown are compounded. Max DD is the largest fall from an equity peak, so it can never exceed 100%.
- "Position size (% of balance)" scales Total and Max DD. 100 = full balance per trade. Values above 100 simulate leverage (300 = 3x). Use it to see what drawdown your own position size or leverage would have produced.
- Lower timeframes in the Timeframes table load data only from the chart's first visible bar, so their results depend on the open chart. Check the "Since" column.
- The free plan loads a limited number of bars, which limits how far back the tests go.
AUTHOR'S OBSERVATIONS
These are observations from the author's own historical tests, not a promise of future results:
- The most stable results came from gold (XAUUSD and gold in TRY) on 1H and 4H.
- 15m was not profitable on any tested asset once commission was included. The moves are too small and too noisy for a breakout system.
- Highly volatile assets (crypto, silver in 2026) produced very deep drawdowns even when the total return was positive.
- On assets with a strong long-term uptrend, short trades had a much lower win rate. "Long only" may be worth testing there.
Always check the Timeframes and Comparison tables on your own symbol before relying on any signal.
ALERTS
BUY, SELL, Long Exit and Short Exit (including ATR stop exits).
CREDITS
- Waddah Attar Explosion: original concept by Waddah Attar. The TradingView version this tool's WAE logic is based on is the [SHK] adaptation by Shayankm, building on LazyBear's port.
- Turtle channel breakout rules: based on the Turtle Trading system of Richard Dennis and William Eckhardt.
- VWAP: standard volume-weighted average price, using TradingView's built-in ta.vwap.
DISCLAIMER
This script is for educational and research purposes only. It is not financial advice. Historical back-test results do not guarantee future performance. The statistics are simulations based on bar data. Slippage is only a simple estimate, and funding fees and execution delays are not included. Trading with leverage can result in the loss of your entire balance.
版本注释
VWAP Surge Pilot (VSP)A breakout trend-following tool that combines three classic ideas, VWAP, Turtle channel breakouts and Waddah Attar Explosion momentum, and adds a built-in back-test engine that compares filter combinations and timeframes for you.
Everything runs inside one indicator, so it works on the free TradingView plan.
HOW SIGNALS ARE BUILT
A BUY signal needs all three core conditions:
1. VWAP direction: price closes above VWAP (below for SELL).
VWAP resets automatically by timeframe: Day on 1H and below, Week on 2H-4H, Month on 6H-1D, Year above that.
2. Turtle channel breakout: price breaks the highest high of the last 20 bars (lowest low for SELL).
The other confirmations may arrive within a few bars after the breakout ("Breakout validity").
3. WAE momentum confirmation: the Waddah Attar Explosion bar has the right color and
- Strict mode: is above the explosion line, or
- Loose mode: is larger than the previous bar.
A dead-zone filter ignores momentum that is too small relative to ATR.
Exits:
- EXIT: price closes beyond the opposite side of the 10-bar exit channel (classic Turtle trailing stop).
- STOP: an optional fixed ATR stop (default 2.5 × ATR) placed at entry. Whichever comes first closes the trade.
- An opposite signal flips the position.
Signals are confirmed on bar close by default, so they do not repaint.
OPTIONAL FILTERS
- Dynamic ADX: ADX must be above its own median of the last 100 bars (with a floor) AND rising, and DI direction must match the signal. The threshold adapts to each asset instead of using a fixed 20/25.
- Volume (Fixed or Dynamic): relative volume spike near the breakout. In Dynamic mode the threshold is a percentile of the asset's own recent relative volume, and the spike candle must point in the signal direction.
- Higher timeframe trend: longs only above, shorts only below a higher-timeframe EMA. The higher timeframe is chosen automatically from the chart timeframe.
- Trade direction: Both / Long only / Short only, for assets with a one-sided long-term trend.
AUTOPILOT
In the background, VSP back-tests all 24 filter combinations (ADX off/dynamic × Volume off/fixed/dynamic × HTF on/off × WAE strict/loose) at the same time, and trades with the combination that has performed best so far.
- Selection uses only trades that have already closed. There is no look-ahead.
- A combination needs a minimum number of trades (default 30) before it can be chosen.
- A switch threshold (default 10%) prevents jumping between combinations that are practically equal.
- The metric can be Profit factor or Return / Drawdown.
Manual mode is available if you prefer to pick the filters yourself.
Default "Auto by market": on 4H, crypto, metals and other non-stock markets use a fixed combination (Dynamic ADX + WAE Loose); stocks and all other timeframes use the Autopilot. This was decided by testing, not by the indicator itself: on 4H the fixed combination beat the Autopilot on 5 of 5 crypto and gold charts, while the Autopilot won on 4 of 6 BIST stocks. On gold 1H and 1D the fixed combination was worse, so it is applied only on 4H. The Statistics panel's last row ("Fixed ref") always shows the fixed combination's result for comparison.
Note: the Statistics panel shows the Autopilot's real walk-forward result. The top row of the Comparison table shows the best combination in hindsight, so it will usually look better than what the Autopilot actually achieved.
PANELS
- Status table: live state of every condition, current position, ATR stop level, active filter combination and the recommended timeframe.
- Statistics: trades, win rate (long/short separately), compounded total return, average trade, profit factor, max drawdown, best/worst trade, ATR stop exits and the open trade.
- Comparison: all 24 filter combinations side by side, sorted by the Autopilot metric. ▶ marks the active one.
- Timeframes: the whole system (Autopilot included) is also run on 15m, 1H, 4H and 1D. ★ marks the timeframe with the best result. The status table warns when the chart is not on it.
HOW THE STATISTICS ARE CALCULATED
- Commission is deducted twice per trade (entry + exit). Default 0.05% one way.
- "Stats start date" (default 01.01.2015): no trades are taken before it, so very old, sparse data does not distort the statistics or the Autopilot. Move it back to use the full history.
- Slippage is deducted the same way to account for worse fills on breakouts and stops. Default 0.02% one way.
- Total return and max drawdown are compounded. Max DD is the largest fall from an equity peak, so it can never exceed 100%.
- "Position size (% of balance)" scales Total and Max DD. 100 = full balance per trade. Values above 100 simulate leverage (300 = 3x). Use it to see what drawdown your own position size or leverage would have produced.
- Lower timeframes in the Timeframes table load data only from the chart's first visible bar, so their results depend on the open chart. Check the "Since" column.
- The free plan loads a limited number of bars, which limits how far back the tests go.
AUTHOR'S OBSERVATIONS
These are observations from the author's own historical tests, not a promise of future results:
- The most stable results came from gold (XAUUSD and gold in TRY) on 1H and 4H.
- 15m was not profitable on any tested asset once commission was included. The moves are too small and too noisy for a breakout system.
- Highly volatile assets (crypto, silver in 2026) produced very deep drawdowns even when the total return was positive.
- On assets with a strong long-term uptrend, short trades had a much lower win rate. "Long only" may be worth testing there.
Always check the Timeframes and Comparison tables on your own symbol before relying on any signal.
ALERTS
BUY, SELL, Long Exit and Short Exit (including ATR stop exits).
CREDITS
- Waddah Attar Explosion: original concept by Waddah Attar. The TradingView version this tool's WAE logic is based on is the [SHK] adaptation by Shayankm, building on LazyBear's port.
- Turtle channel breakout rules: based on the Turtle Trading system of Richard Dennis and William Eckhardt.
- VWAP: standard volume-weighted average price, using TradingView's built-in ta.vwap.
DISCLAIMER
This script is for educational and research purposes only. It is not financial advice. Historical back-test results do not guarantee future performance. The statistics are simulations based on bar data. Slippage is only a simple estimate, and funding fees and execution delays are not included. Trading with leverage can result in the loss of your entire balance.
版本注释
VWAP Surge Pilot (VSP)A breakout trend-following tool that combines three classic ideas, VWAP, Turtle channel breakouts and Waddah Attar Explosion momentum, and adds a built-in back-test engine that compares filter combinations and timeframes for you.
Everything runs inside one indicator, so it works on the free TradingView plan.
HOW SIGNALS ARE BUILT
A BUY signal needs all three core conditions:
1. VWAP direction: price closes above VWAP (below for SELL).
VWAP resets automatically by timeframe: Day on 1H and below, Week on 2H-4H, Month on 6H-1D, Year above that.
2. Turtle channel breakout: price breaks the highest high of the last 20 bars (lowest low for SELL).
The other confirmations may arrive within a few bars after the breakout ("Breakout validity").
3. WAE momentum confirmation: the Waddah Attar Explosion bar has the right color and
- Strict mode: is above the explosion line, or
- Loose mode: is larger than the previous bar.
A dead-zone filter ignores momentum that is too small relative to ATR.
Exits:
- EXIT: price closes beyond the opposite side of the 10-bar exit channel (classic Turtle trailing stop).
- STOP: an optional fixed ATR stop (default 2.5 × ATR) placed at entry. Whichever comes first closes the trade.
- An opposite signal flips the position.
Signals are confirmed on bar close by default, so they do not repaint.
OPTIONAL FILTERS
- Dynamic ADX: ADX must be above its own median of the last 100 bars (with a floor) AND rising, and DI direction must match the signal. The threshold adapts to each asset instead of using a fixed 20/25.
- Volume (Fixed or Dynamic): relative volume spike near the breakout. In Dynamic mode the threshold is a percentile of the asset's own recent relative volume, and the spike candle must point in the signal direction.
- Higher timeframe trend: longs only above, shorts only below a higher-timeframe EMA. The higher timeframe is chosen automatically from the chart timeframe.
- Trade direction: Both / Long only / Short only, for assets with a one-sided long-term trend.
AUTOPILOT
In the background, VSP back-tests all 24 filter combinations (ADX off/dynamic × Volume off/fixed/dynamic × HTF on/off × WAE strict/loose) at the same time, and trades with the combination that has performed best so far.
- Selection uses only trades that have already closed. There is no look-ahead.
- A combination needs a minimum number of trades (default 30) before it can be chosen.
- A switch threshold (default 10%) prevents jumping between combinations that are practically equal.
- The metric can be Profit factor or Return / Drawdown.
Manual mode is available if you prefer to pick the filters yourself.
Default "Auto by market": on 4H, crypto, metals and other non-stock markets use a fixed combination (Dynamic ADX + WAE Loose); stocks and all other timeframes use the Autopilot. This was decided by testing, not by the indicator itself: on 4H the fixed combination beat the Autopilot on 5 of 5 crypto and gold charts, while the Autopilot won on 4 of 6 BIST stocks. On gold 1H and 1D the fixed combination was worse, so it is applied only on 4H. The Statistics panel's last row ("Fixed ref") always shows the fixed combination's result for comparison.
Note: the Statistics panel shows the Autopilot's real walk-forward result. The top row of the Comparison table shows the best combination in hindsight, so it will usually look better than what the Autopilot actually achieved.
PANELS
Panel mode: Simple (default, one panel with all key rows), Detailed (the four tables below) or Mobile (a 6-row mini panel for phones). Calculations are the same in every mode.
- Status table: live state of every condition, current position, ATR stop level, active filter combination and the recommended timeframe.
- Statistics: trades, win rate (long/short separately), compounded total return, average trade, profit factor, max drawdown, best/worst trade, ATR stop exits and the open trade.
- Comparison: all 24 filter combinations side by side, sorted by the Autopilot metric. ▶ marks the active one.
- Timeframes: the whole system (Autopilot included) is also run on 15m, 1H, 4H and 1D. ★ marks the timeframe with the best result. The status table warns when the chart is not on it.
HOW THE STATISTICS ARE CALCULATED
- Commission is deducted twice per trade (entry + exit). Default 0.05% one way.
- "Stats start date" (default 01.01.2015): no trades are taken before it, so very old, sparse data does not distort the statistics or the Autopilot. Move it back to use the full history.
- Slippage is deducted the same way to account for worse fills on breakouts and stops. Default 0.02% one way.
- Total return and max drawdown are compounded. Max DD is the largest fall from an equity peak, so it can never exceed 100%.
- "Position size (% of balance)" scales Total and Max DD. 100 = full balance per trade. Values above 100 simulate leverage (300 = 3x). Use it to see what drawdown your own position size or leverage would have produced.
- Lower timeframes in the Timeframes table load data only from the chart's first visible bar, so their results depend on the open chart. Check the "Since" column.
- The free plan loads a limited number of bars, which limits how far back the tests go.
AUTHOR'S OBSERVATIONS
These are observations from the author's own historical tests, not a promise of future results:
- The most stable results came from gold (XAUUSD and gold in TRY) on 1H and 4H.
- 15m was not profitable on any tested asset once commission was included. The moves are too small and too noisy for a breakout system.
- Highly volatile assets (crypto, silver in 2026) produced very deep drawdowns even when the total return was positive.
- On assets with a strong long-term uptrend, short trades had a much lower win rate. "Long only" may be worth testing there.
Always check the Timeframes and Comparison tables on your own symbol before relying on any signal.
ALERTS
BUY, SELL, Long Exit and Short Exit (including ATR stop exits).
CREDITS
- Waddah Attar Explosion: original concept by Waddah Attar. The TradingView version this tool's WAE logic is based on is the [SHK] adaptation by Shayankm, building on LazyBear's port.
- Turtle channel breakout rules: based on the Turtle Trading system of Richard Dennis and William Eckhardt.
- VWAP: standard volume-weighted average price, using TradingView's built-in ta.vwap.
DISCLAIMER
This script is for educational and research purposes only. It is not financial advice. Historical back-test results do not guarantee future performance. The statistics are simulations based on bar data. Slippage is only a simple estimate, and funding fees and execution delays are not included. Trading with leverage can result in the loss of your entire balance.

免责声明
这些信息和出版物并非旨在提供,也不构成TradingView提供或认可的任何形式的财务、投资、交易或其他类型的建议或推荐。请阅读使用条款了解更多信息。
免责声明
这些信息和出版物并非旨在提供,也不构成TradingView提供或认可的任何形式的财务、投资、交易或其他类型的建议或推荐。请阅读使用条款了解更多信息。