OPEN-SOURCE SCRIPT
Dynamic Stop-Loss Using Expected Move [v1]
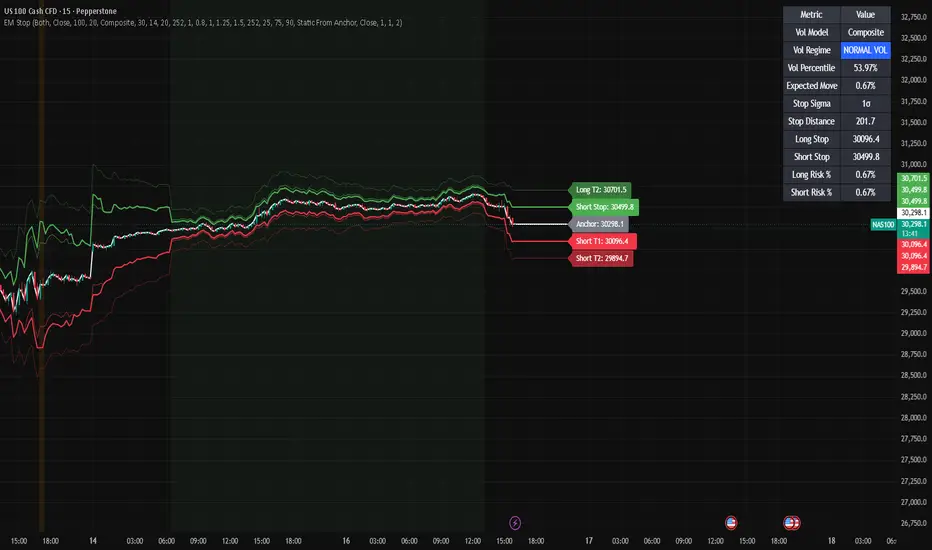
Dynamic Stop-Loss Using Expected Move
The Dynamic Stop-Loss Using Expected Move indicator is a volatility-aware risk management tool designed to help traders place adaptive stop-loss levels based on the expected price movement of the market.
Instead of using a fixed pip, point, or percentage stop, this indicator estimates how far price could reasonably move over a selected holding period and then converts that expected move into dynamic long and short stop levels.
This is not a buy or sell signal indicator.
It is a risk-management framework designed to answer:
“How far can price reasonably move against my position before the trade thesis is likely invalidated?”
The indicator can be used across FX, crypto, indices, commodities, futures, and liquid stocks.
WHAT THE INDICATOR DOES
━━━━━━━━━━━━━━━━━━━━━━
The indicator calculates a volatility-based expected move over a selected holding period.
It then uses that expected move to build adaptive stop-loss levels for long and short positions.
The basic logic is:
Expected Move = Entry Anchor × Volatility × Square Root of Holding Period
The stop distance is then calculated as:
Stop Distance = Expected Move × Stop Sigma × Volatility Regime Multiplier
For a long position:
Long Stop = Entry Anchor - Stop Distance
For a short position:
Short Stop = Entry Anchor + Stop Distance
This means the stop automatically responds to volatility.
When volatility rises, the stop becomes wider.
When volatility falls, the stop becomes tighter.
WHY THIS INDICATOR IS USEFUL
━━━━━━━━━━━━━━━━━━━━━━
Static stops can be too tight during volatile regimes and too wide during compressed regimes.
This indicator tries to solve that problem by adjusting the stop distance according to current market volatility.
The goal is not to avoid every losing trade.
The goal is to place stops that are more consistent with the current volatility environment.
This can help traders:
• Avoid stops that are too tight during high volatility
• Avoid unnecessarily wide stops during low volatility
• Plan trade risk before entry
• Compare stop distance to expected reward
• Adjust stop logic across different markets and timeframes
• Use volatility as part of position sizing and trade management
MAIN COMPONENTS
━━━━━━━━━━━━━━━━━━━━━━
1. Entry Anchor
The entry anchor is the reference price used to calculate the stop and target levels.
The script allows four anchor modes:
• Close
• Manual
• EMA
• VWAP
Close uses the latest closing price.
Manual allows the trader to enter a specific entry price.
EMA uses a moving average as the anchor.
VWAP uses volume-weighted average price as the anchor.
For pre-trade planning, Manual is often the most precise because it lets the trader set the actual intended entry level.
For live chart context, Close or EMA may be easier to use.
2. Volatility Model
The indicator supports three volatility models:
• Realized Volatility
• ATR Proxy
• Composite
Realized Volatility uses log returns and rolling standard deviation.
ATR Proxy uses average true range as a percentage of price.
Composite blends realized volatility and ATR volatility.
Realized Volatility is cleaner from a statistical perspective.
ATR Proxy is more range-sensitive.
Composite is usually the most practical default because it captures both close-to-close volatility and intrabar range behaviour.
3. Expected Holding Period
The holding period is the number of bars the trader expects to hold the trade.
For example:
• On a 1-hour chart, 20 bars means roughly 20 trading hours
• On a daily chart, 10 bars means roughly 10 trading days
• On a 5-minute chart, 24 bars means roughly 2 trading hours
The holding period matters because expected move increases with time.
Longer holding periods create wider expected moves.
Shorter holding periods create tighter expected moves.
4. Bars Per Year
Bars Per Year is used to annualize and de-annualize volatility correctly.
Suggested settings:
• Daily FX / indices: 252
• Daily crypto: 365
• 1-hour FX: approximately 6240
• 1-hour crypto: approximately 8760
The correct value depends on the asset class and timeframe.
5. Stop Sigma
Stop Sigma controls how much of the expected move is used for the stop distance.
For example:
• 1.0σ means the stop is placed around one expected move away
• 1.5σ means the stop is wider
• 2.0σ means the stop is more defensive
Lower sigma creates tighter stops.
Higher sigma creates wider stops.
6. Volatility Regime Multiplier
The indicator can adjust the stop distance based on the volatility regime.
Default logic:
• Low Vol: tighter stop multiplier
• Normal Vol: standard stop multiplier
• High Vol: wider stop multiplier
• Extreme Vol: widest stop multiplier
This helps prevent the stop from being too tight when volatility is elevated.
7. Stop Mode
The script includes three stop modes:
• Static From Anchor
• Trailing
• Ratchet Only
Static From Anchor keeps the stop based on the selected anchor.
Trailing moves the stop based on the latest price or high/low reference.
Ratchet Only only moves the stop in a favourable direction.
For live trade management, Ratchet Only is usually the most practical because it avoids loosening the stop after it has already tightened.
8. Break-Even Rule
The script includes an optional break-even rule.
When enabled, the stop can move to the entry anchor after price moves a selected number of sigma in favour of the trade.
For example, if the break-even trigger is 1.0σ, the stop will move to break-even after price moves one expected move in the trader’s favour.
This can help protect trades after the market confirms the initial direction.
9. Expected Move Targets
The indicator can also plot expected move targets.
Targets are calculated using the same expected move logic as the stop.
For long positions:
• Long Target 1 is above the entry anchor
• Long Target 2 is further above the entry anchor
For short positions:
• Short Target 1 is below the entry anchor
• Short Target 2 is further below the entry anchor
These targets are not predictions.
They are volatility-adjusted reference levels for planning reward-to-risk.
HOW TO READ THE INDICATOR
━━━━━━━━━━━━━━━━━━━━━━
The indicator plots the following on the price chart:
• Entry Anchor
• Long Dynamic Stop
• Short Dynamic Stop
• Long Target 1
• Long Target 2
• Short Target 1
• Short Target 2
• Forward projected stop and target lines
• Dashboard with volatility and risk metrics
Colour guide:
• White line = Entry Anchor
• Red line = Long Stop
• Green line = Short Stop
• Green upper lines = Long targets
• Red lower lines = Short targets
The dashboard shows:
• Volatility Model
• Volatility Regime
• Volatility Percentile
• Expected Move
• Stop Sigma
• Stop Distance
• Long Stop
• Short Stop
• Long Risk %
• Short Risk %
VOLATILITY REGIME INTERPRETATION
━━━━━━━━━━━━━━━━━━━━━━
The indicator classifies volatility into four regimes:
Low Vol
Low volatility means the market is compressed relative to recent history.
In this environment, stops may be tighter because price movement is currently smaller.
However, traders should be aware that low volatility can sometimes precede a breakout.
Normal Vol
Normal volatility means price movement is close to its recent historical range.
This is usually the cleanest environment for standard stop logic.
High Vol
High volatility means price movement is elevated.
In this environment, stops generally need to be wider and position size should usually be smaller.
Tight stops are more likely to be hit during high volatility.
Extreme Vol
Extreme volatility means the market is in a stress or shock regime.
This can happen during economic data releases, central bank decisions, earnings shocks, crypto liquidations, geopolitical events, or major breakouts.
In this environment, traders should be careful with leverage and avoid using normal-volatility stop assumptions.
HOW TO USE THE INDICATOR
━━━━━━━━━━━━━━━━━━━━━━
Use the indicator as a risk engine.
It is designed to help with stop placement, target planning, and trade management.
It should not be used as a standalone entry signal.
The main workflow is:
1. Choose the position mode.
Select Long, Short, or Both.
Use Long if planning a long trade.
Use Short if planning a short trade.
Use Both if comparing both sides.
2. Choose the entry anchor.
Use Manual if you know your exact planned entry price.
Use Close for live chart reference.
Use EMA for a smoother trend-based anchor.
Use VWAP for intraday execution context.
3. Choose the volatility model.
Use Realized Volatility for statistically cleaner expected move calculations.
Use ATR Proxy for a more range-sensitive stop.
Use Composite for a balanced model.
4. Set the expected holding period.
Match this to your trade horizon.
A scalp should use fewer bars.
A swing trade should use more bars.
5. Set the stop sigma.
Use a lower sigma for tighter stops.
Use a higher sigma for wider stops.
Common starting points:
• 1.0σ for tighter tactical stops
• 1.25σ to 1.5σ for balanced stops
• 2.0σ for wider defensive stops
6. Check the volatility regime.
If volatility is high or extreme, the stop will widen if the regime multiplier is enabled.
This helps the stop adapt to the current environment.
7. Compare stop distance to target distance.
Do not only ask whether the stop looks reasonable.
Ask whether the trade still has acceptable reward-to-risk.
8. Use price structure for execution.
The indicator helps with stop placement.
It does not decide trade direction.
Entries should still be based on price action, market structure, trend, support/resistance, liquidity, or macro context.
STOP MODE GUIDE
━━━━━━━━━━━━━━━━━━━━━━
Static From Anchor
This mode keeps the stop based on the selected entry anchor.
Best for:
• Pre-trade planning
• Fixed trade thesis invalidation
• Manual entry planning
• Swing trade risk planning
This mode is clean and stable.
Trailing
This mode recalculates the stop based on the latest price movement.
Best for:
• Active trade management
• Fast-moving markets
• Short-term trading
However, this mode can move the stop both tighter and looser depending on price and volatility.
Ratchet Only
This mode only moves the stop in the trader’s favour.
For long positions, the stop can move higher but not lower.
For short positions, the stop can move lower but not higher.
Best for:
• Live trade management
• Trend-following
• Protecting open profits
• Reducing discretionary stop movement
Ratchet Only is usually the best mode for managing trades after entry.
BREAK-EVEN RULE GUIDE
━━━━━━━━━━━━━━━━━━━━━━
The break-even rule moves the stop to the entry anchor after price has moved a selected number of sigma in favour of the position.
Example:
If Break-Even Trigger is 1.0σ:
• A long trade moves to break-even after price rises by one expected move
• A short trade moves to break-even after price falls by one expected move
This is useful when the trader wants to reduce downside risk after the trade has started working.
However, moving to break-even too early can also stop out good trades before continuation.
A practical setting is usually between 1.0σ and 1.5σ.
SUGGESTED SETTINGS
━━━━━━━━━━━━━━━━━━━━━━
FX 1-Hour
• Position Mode: Long, Short, or Both
• Entry Anchor Mode: Manual or Close
• Volatility Model: Realized Volatility or Composite
• Realized Volatility Lookback: 30 to 50
• ATR Lookback: 14
• Expected Holding Period: 20 to 24
• Bars Per Year: 6240
• Base Stop Sigma: 1.0 to 1.5
• Stop Mode: Static From Anchor or Ratchet Only
Crypto 1-Hour
• Position Mode: Long, Short, or Both
• Entry Anchor Mode: Manual or Close
• Volatility Model: Composite
• Realized Volatility Lookback: 50
• ATR Lookback: 14 to 21
• Expected Holding Period: 24
• Bars Per Year: 8760
• Base Stop Sigma: 1.25 to 2.0
• Stop Mode: Ratchet Only
Daily Equities / Indices
• Position Mode: Long, Short, or Both
• Entry Anchor Mode: Manual or EMA
• EMA Length: 20 or 50
• Volatility Model: Composite
• Realized Volatility Lookback: 20 to 30
• ATR Lookback: 14
• Expected Holding Period: 10 to 20
• Bars Per Year: 252
• Base Stop Sigma: 1.0 to 1.5
• Stop Mode: Ratchet Only
Intraday Indices
• Position Mode: Long, Short, or Both
• Entry Anchor Mode: VWAP, Close, or Manual
• Volatility Model: Composite
• Realized Volatility Lookback: 30 to 50
• ATR Lookback: 14
• Expected Holding Period: 12 to 48
• Bars Per Year: adjust to timeframe
• Base Stop Sigma: 1.25 to 2.0
• Stop Mode: Ratchet Only
PRACTICAL EXAMPLES
━━━━━━━━━━━━━━━━━━━━━━
Example 1: Long Trade Planning
A trader is planning a long EUR/USD trade on the 1-hour chart.
The intended entry is 1.1500.
The indicator estimates a 20-bar expected move of 0.40%.
The stop sigma is set to 1.25σ.
The model calculates a long stop below the entry anchor.
The trader can now compare:
• Entry price
• Dynamic stop
• Long Target 1
• Long Target 2
• Volatility regime
• Risk percentage
If the stop is too wide relative to the target, the trade may not offer attractive reward-to-risk.
Example 2: Short Trade Planning
A trader is planning a short trade after price breaks support.
The trader sets Position Mode to Short.
The script plots a short stop above the entry anchor and downside targets below it.
If volatility is high, the stop will be wider.
This helps avoid placing the stop too close during a fast market.
Example 3: High Volatility Regime
The dashboard shows Extreme Vol.
The model widens the stop using the extreme volatility multiplier.
This does not mean the trade is good or bad.
It means the market requires more room because price movement is elevated.
The trader may respond by:
• Reducing position size
• Waiting for volatility to cool
• Using wider stops
• Avoiding over-leverage
• Reassessing whether the reward justifies the risk
Example 4: Ratchet Stop Management
A trader enters a long position and selects Ratchet Only mode.
As price rises, the stop moves higher.
If price falls, the stop does not move lower.
This allows the trader to protect open profits while still using volatility-adjusted stop logic.
RISK MANAGEMENT NOTES
━━━━━━━━━━━━━━━━━━━━━━
This indicator is most useful when combined with disciplined position sizing.
A wider volatility stop does not mean taking more risk.
It usually means reducing position size so that the cash risk remains controlled.
For example:
If the stop distance doubles, position size should generally be reduced by half to keep the same account risk.
Practical risk rules:
• Define account risk before using the stop
• Do not widen stops without reducing size
• Avoid using tight stops in high-volatility regimes
• Avoid using very wide stops without sufficient reward potential
• Use the stop as invalidation, not as a random distance
• Do not treat target levels as guaranteed price forecasts
HOW TO COMBINE WITH OTHER INDICATORS
━━━━━━━━━━━━━━━━━━━━━━
This indicator works best as part of a broader volatility and market-structure framework.
Useful combinations:
• Expected Move Bands
• Realized Volatility Regime Indicator
• Implied Volatility Proxy
• Delta-Hedging Pressure Proxy
• VWAP
• Moving averages
• Support and resistance
• Liquidity zones
• Market structure breaks
• Macro and event calendars
Suggested framework:
Expected Move Bands show where price may reasonably move.
Realized Volatility Regime shows whether volatility is low, normal, high, or extreme.
IV Proxy shows whether broader uncertainty is rising or cooling.
Delta-Hedging Pressure Proxy shows whether directional pressure is positive or negative.
Dynamic Stop-Loss Using Expected Move converts volatility into actionable risk levels.
Together, these tools help answer:
• How far can price move?
• What volatility regime are we in?
• Is uncertainty rising or cooling?
• Is directional pressure positive or negative?
• Where should the stop be placed?
• Is the reward-to-risk acceptable?
• Should position size be reduced?
WHAT THIS INDICATOR IS BEST FOR
━━━━━━━━━━━━━━━━━━━━━━
This indicator is best used for:
• Volatility-adjusted stop placement
• Trade risk planning
• Expected move-based target planning
• Position management
• Stop distance calibration
• Risk percentage monitoring
• High-volatility regime adjustment
• Avoiding random stop placement
• Improving reward-to-risk discipline
It is useful for traders who want stop placement to be linked to market conditions instead of fixed distances.
WHAT THIS INDICATOR IS NOT
━━━━━━━━━━━━━━━━━━━━━━
This indicator is not:
• A buy or sell signal generator
• A standalone trading strategy
• A guarantee that the stop will not be hit
• A prediction model
• A replacement for position sizing
• A replacement for market structure
• A complete trading system
The indicator tells you where a volatility-adjusted stop may be placed.
It does not tell you whether the trade should be entered.
IMPORTANT LIMITATIONS
━━━━━━━━━━━━━━━━━━━━━━
The indicator uses historical volatility and range behaviour.
It does not know future volatility.
Volatility can change rapidly after:
• Economic data releases
• Central bank decisions
• Earnings reports
• Geopolitical events
• Liquidity shocks
• Market opens and closes
• Crypto liquidation cascades
• Sudden order-flow imbalance
The indicator does not include:
• Options implied volatility
• Order flow
• Market depth
• Positioning data
• News sentiment
• Fundamental data
• Liquidity conditions
A volatility-based stop can still be hit during a normal adverse move.
It should be used with position sizing, trade invalidation logic, and market structure.
FINAL NOTES
━━━━━━━━━━━━━━━━━━━━━━
The Dynamic Stop-Loss Using Expected Move indicator helps traders convert volatility into practical risk levels.
Instead of asking only where support or resistance is, this tool helps answer:
• How far can price reasonably move against me?
• Is my stop too tight for current volatility?
• Is my stop too wide for the expected reward?
• Should my position size be reduced?
• Should the stop trail or stay fixed?
• Has volatility changed enough to alter my risk assumptions?
The indicator is designed to improve trade planning, stop discipline, and volatility-aware risk management.
The Dynamic Stop-Loss Using Expected Move indicator is a volatility-aware risk management tool designed to help traders place adaptive stop-loss levels based on the expected price movement of the market.
Instead of using a fixed pip, point, or percentage stop, this indicator estimates how far price could reasonably move over a selected holding period and then converts that expected move into dynamic long and short stop levels.
This is not a buy or sell signal indicator.
It is a risk-management framework designed to answer:
“How far can price reasonably move against my position before the trade thesis is likely invalidated?”
The indicator can be used across FX, crypto, indices, commodities, futures, and liquid stocks.
WHAT THE INDICATOR DOES
━━━━━━━━━━━━━━━━━━━━━━
The indicator calculates a volatility-based expected move over a selected holding period.
It then uses that expected move to build adaptive stop-loss levels for long and short positions.
The basic logic is:
Expected Move = Entry Anchor × Volatility × Square Root of Holding Period
The stop distance is then calculated as:
Stop Distance = Expected Move × Stop Sigma × Volatility Regime Multiplier
For a long position:
Long Stop = Entry Anchor - Stop Distance
For a short position:
Short Stop = Entry Anchor + Stop Distance
This means the stop automatically responds to volatility.
When volatility rises, the stop becomes wider.
When volatility falls, the stop becomes tighter.
WHY THIS INDICATOR IS USEFUL
━━━━━━━━━━━━━━━━━━━━━━
Static stops can be too tight during volatile regimes and too wide during compressed regimes.
This indicator tries to solve that problem by adjusting the stop distance according to current market volatility.
The goal is not to avoid every losing trade.
The goal is to place stops that are more consistent with the current volatility environment.
This can help traders:
• Avoid stops that are too tight during high volatility
• Avoid unnecessarily wide stops during low volatility
• Plan trade risk before entry
• Compare stop distance to expected reward
• Adjust stop logic across different markets and timeframes
• Use volatility as part of position sizing and trade management
MAIN COMPONENTS
━━━━━━━━━━━━━━━━━━━━━━
1. Entry Anchor
The entry anchor is the reference price used to calculate the stop and target levels.
The script allows four anchor modes:
• Close
• Manual
• EMA
• VWAP
Close uses the latest closing price.
Manual allows the trader to enter a specific entry price.
EMA uses a moving average as the anchor.
VWAP uses volume-weighted average price as the anchor.
For pre-trade planning, Manual is often the most precise because it lets the trader set the actual intended entry level.
For live chart context, Close or EMA may be easier to use.
2. Volatility Model
The indicator supports three volatility models:
• Realized Volatility
• ATR Proxy
• Composite
Realized Volatility uses log returns and rolling standard deviation.
ATR Proxy uses average true range as a percentage of price.
Composite blends realized volatility and ATR volatility.
Realized Volatility is cleaner from a statistical perspective.
ATR Proxy is more range-sensitive.
Composite is usually the most practical default because it captures both close-to-close volatility and intrabar range behaviour.
3. Expected Holding Period
The holding period is the number of bars the trader expects to hold the trade.
For example:
• On a 1-hour chart, 20 bars means roughly 20 trading hours
• On a daily chart, 10 bars means roughly 10 trading days
• On a 5-minute chart, 24 bars means roughly 2 trading hours
The holding period matters because expected move increases with time.
Longer holding periods create wider expected moves.
Shorter holding periods create tighter expected moves.
4. Bars Per Year
Bars Per Year is used to annualize and de-annualize volatility correctly.
Suggested settings:
• Daily FX / indices: 252
• Daily crypto: 365
• 1-hour FX: approximately 6240
• 1-hour crypto: approximately 8760
The correct value depends on the asset class and timeframe.
5. Stop Sigma
Stop Sigma controls how much of the expected move is used for the stop distance.
For example:
• 1.0σ means the stop is placed around one expected move away
• 1.5σ means the stop is wider
• 2.0σ means the stop is more defensive
Lower sigma creates tighter stops.
Higher sigma creates wider stops.
6. Volatility Regime Multiplier
The indicator can adjust the stop distance based on the volatility regime.
Default logic:
• Low Vol: tighter stop multiplier
• Normal Vol: standard stop multiplier
• High Vol: wider stop multiplier
• Extreme Vol: widest stop multiplier
This helps prevent the stop from being too tight when volatility is elevated.
7. Stop Mode
The script includes three stop modes:
• Static From Anchor
• Trailing
• Ratchet Only
Static From Anchor keeps the stop based on the selected anchor.
Trailing moves the stop based on the latest price or high/low reference.
Ratchet Only only moves the stop in a favourable direction.
For live trade management, Ratchet Only is usually the most practical because it avoids loosening the stop after it has already tightened.
8. Break-Even Rule
The script includes an optional break-even rule.
When enabled, the stop can move to the entry anchor after price moves a selected number of sigma in favour of the trade.
For example, if the break-even trigger is 1.0σ, the stop will move to break-even after price moves one expected move in the trader’s favour.
This can help protect trades after the market confirms the initial direction.
9. Expected Move Targets
The indicator can also plot expected move targets.
Targets are calculated using the same expected move logic as the stop.
For long positions:
• Long Target 1 is above the entry anchor
• Long Target 2 is further above the entry anchor
For short positions:
• Short Target 1 is below the entry anchor
• Short Target 2 is further below the entry anchor
These targets are not predictions.
They are volatility-adjusted reference levels for planning reward-to-risk.
HOW TO READ THE INDICATOR
━━━━━━━━━━━━━━━━━━━━━━
The indicator plots the following on the price chart:
• Entry Anchor
• Long Dynamic Stop
• Short Dynamic Stop
• Long Target 1
• Long Target 2
• Short Target 1
• Short Target 2
• Forward projected stop and target lines
• Dashboard with volatility and risk metrics
Colour guide:
• White line = Entry Anchor
• Red line = Long Stop
• Green line = Short Stop
• Green upper lines = Long targets
• Red lower lines = Short targets
The dashboard shows:
• Volatility Model
• Volatility Regime
• Volatility Percentile
• Expected Move
• Stop Sigma
• Stop Distance
• Long Stop
• Short Stop
• Long Risk %
• Short Risk %
VOLATILITY REGIME INTERPRETATION
━━━━━━━━━━━━━━━━━━━━━━
The indicator classifies volatility into four regimes:
Low Vol
Low volatility means the market is compressed relative to recent history.
In this environment, stops may be tighter because price movement is currently smaller.
However, traders should be aware that low volatility can sometimes precede a breakout.
Normal Vol
Normal volatility means price movement is close to its recent historical range.
This is usually the cleanest environment for standard stop logic.
High Vol
High volatility means price movement is elevated.
In this environment, stops generally need to be wider and position size should usually be smaller.
Tight stops are more likely to be hit during high volatility.
Extreme Vol
Extreme volatility means the market is in a stress or shock regime.
This can happen during economic data releases, central bank decisions, earnings shocks, crypto liquidations, geopolitical events, or major breakouts.
In this environment, traders should be careful with leverage and avoid using normal-volatility stop assumptions.
HOW TO USE THE INDICATOR
━━━━━━━━━━━━━━━━━━━━━━
Use the indicator as a risk engine.
It is designed to help with stop placement, target planning, and trade management.
It should not be used as a standalone entry signal.
The main workflow is:
1. Choose the position mode.
Select Long, Short, or Both.
Use Long if planning a long trade.
Use Short if planning a short trade.
Use Both if comparing both sides.
2. Choose the entry anchor.
Use Manual if you know your exact planned entry price.
Use Close for live chart reference.
Use EMA for a smoother trend-based anchor.
Use VWAP for intraday execution context.
3. Choose the volatility model.
Use Realized Volatility for statistically cleaner expected move calculations.
Use ATR Proxy for a more range-sensitive stop.
Use Composite for a balanced model.
4. Set the expected holding period.
Match this to your trade horizon.
A scalp should use fewer bars.
A swing trade should use more bars.
5. Set the stop sigma.
Use a lower sigma for tighter stops.
Use a higher sigma for wider stops.
Common starting points:
• 1.0σ for tighter tactical stops
• 1.25σ to 1.5σ for balanced stops
• 2.0σ for wider defensive stops
6. Check the volatility regime.
If volatility is high or extreme, the stop will widen if the regime multiplier is enabled.
This helps the stop adapt to the current environment.
7. Compare stop distance to target distance.
Do not only ask whether the stop looks reasonable.
Ask whether the trade still has acceptable reward-to-risk.
8. Use price structure for execution.
The indicator helps with stop placement.
It does not decide trade direction.
Entries should still be based on price action, market structure, trend, support/resistance, liquidity, or macro context.
STOP MODE GUIDE
━━━━━━━━━━━━━━━━━━━━━━
Static From Anchor
This mode keeps the stop based on the selected entry anchor.
Best for:
• Pre-trade planning
• Fixed trade thesis invalidation
• Manual entry planning
• Swing trade risk planning
This mode is clean and stable.
Trailing
This mode recalculates the stop based on the latest price movement.
Best for:
• Active trade management
• Fast-moving markets
• Short-term trading
However, this mode can move the stop both tighter and looser depending on price and volatility.
Ratchet Only
This mode only moves the stop in the trader’s favour.
For long positions, the stop can move higher but not lower.
For short positions, the stop can move lower but not higher.
Best for:
• Live trade management
• Trend-following
• Protecting open profits
• Reducing discretionary stop movement
Ratchet Only is usually the best mode for managing trades after entry.
BREAK-EVEN RULE GUIDE
━━━━━━━━━━━━━━━━━━━━━━
The break-even rule moves the stop to the entry anchor after price has moved a selected number of sigma in favour of the position.
Example:
If Break-Even Trigger is 1.0σ:
• A long trade moves to break-even after price rises by one expected move
• A short trade moves to break-even after price falls by one expected move
This is useful when the trader wants to reduce downside risk after the trade has started working.
However, moving to break-even too early can also stop out good trades before continuation.
A practical setting is usually between 1.0σ and 1.5σ.
SUGGESTED SETTINGS
━━━━━━━━━━━━━━━━━━━━━━
FX 1-Hour
• Position Mode: Long, Short, or Both
• Entry Anchor Mode: Manual or Close
• Volatility Model: Realized Volatility or Composite
• Realized Volatility Lookback: 30 to 50
• ATR Lookback: 14
• Expected Holding Period: 20 to 24
• Bars Per Year: 6240
• Base Stop Sigma: 1.0 to 1.5
• Stop Mode: Static From Anchor or Ratchet Only
Crypto 1-Hour
• Position Mode: Long, Short, or Both
• Entry Anchor Mode: Manual or Close
• Volatility Model: Composite
• Realized Volatility Lookback: 50
• ATR Lookback: 14 to 21
• Expected Holding Period: 24
• Bars Per Year: 8760
• Base Stop Sigma: 1.25 to 2.0
• Stop Mode: Ratchet Only
Daily Equities / Indices
• Position Mode: Long, Short, or Both
• Entry Anchor Mode: Manual or EMA
• EMA Length: 20 or 50
• Volatility Model: Composite
• Realized Volatility Lookback: 20 to 30
• ATR Lookback: 14
• Expected Holding Period: 10 to 20
• Bars Per Year: 252
• Base Stop Sigma: 1.0 to 1.5
• Stop Mode: Ratchet Only
Intraday Indices
• Position Mode: Long, Short, or Both
• Entry Anchor Mode: VWAP, Close, or Manual
• Volatility Model: Composite
• Realized Volatility Lookback: 30 to 50
• ATR Lookback: 14
• Expected Holding Period: 12 to 48
• Bars Per Year: adjust to timeframe
• Base Stop Sigma: 1.25 to 2.0
• Stop Mode: Ratchet Only
PRACTICAL EXAMPLES
━━━━━━━━━━━━━━━━━━━━━━
Example 1: Long Trade Planning
A trader is planning a long EUR/USD trade on the 1-hour chart.
The intended entry is 1.1500.
The indicator estimates a 20-bar expected move of 0.40%.
The stop sigma is set to 1.25σ.
The model calculates a long stop below the entry anchor.
The trader can now compare:
• Entry price
• Dynamic stop
• Long Target 1
• Long Target 2
• Volatility regime
• Risk percentage
If the stop is too wide relative to the target, the trade may not offer attractive reward-to-risk.
Example 2: Short Trade Planning
A trader is planning a short trade after price breaks support.
The trader sets Position Mode to Short.
The script plots a short stop above the entry anchor and downside targets below it.
If volatility is high, the stop will be wider.
This helps avoid placing the stop too close during a fast market.
Example 3: High Volatility Regime
The dashboard shows Extreme Vol.
The model widens the stop using the extreme volatility multiplier.
This does not mean the trade is good or bad.
It means the market requires more room because price movement is elevated.
The trader may respond by:
• Reducing position size
• Waiting for volatility to cool
• Using wider stops
• Avoiding over-leverage
• Reassessing whether the reward justifies the risk
Example 4: Ratchet Stop Management
A trader enters a long position and selects Ratchet Only mode.
As price rises, the stop moves higher.
If price falls, the stop does not move lower.
This allows the trader to protect open profits while still using volatility-adjusted stop logic.
RISK MANAGEMENT NOTES
━━━━━━━━━━━━━━━━━━━━━━
This indicator is most useful when combined with disciplined position sizing.
A wider volatility stop does not mean taking more risk.
It usually means reducing position size so that the cash risk remains controlled.
For example:
If the stop distance doubles, position size should generally be reduced by half to keep the same account risk.
Practical risk rules:
• Define account risk before using the stop
• Do not widen stops without reducing size
• Avoid using tight stops in high-volatility regimes
• Avoid using very wide stops without sufficient reward potential
• Use the stop as invalidation, not as a random distance
• Do not treat target levels as guaranteed price forecasts
HOW TO COMBINE WITH OTHER INDICATORS
━━━━━━━━━━━━━━━━━━━━━━
This indicator works best as part of a broader volatility and market-structure framework.
Useful combinations:
• Expected Move Bands
• Realized Volatility Regime Indicator
• Implied Volatility Proxy
• Delta-Hedging Pressure Proxy
• VWAP
• Moving averages
• Support and resistance
• Liquidity zones
• Market structure breaks
• Macro and event calendars
Suggested framework:
Expected Move Bands show where price may reasonably move.
Realized Volatility Regime shows whether volatility is low, normal, high, or extreme.
IV Proxy shows whether broader uncertainty is rising or cooling.
Delta-Hedging Pressure Proxy shows whether directional pressure is positive or negative.
Dynamic Stop-Loss Using Expected Move converts volatility into actionable risk levels.
Together, these tools help answer:
• How far can price move?
• What volatility regime are we in?
• Is uncertainty rising or cooling?
• Is directional pressure positive or negative?
• Where should the stop be placed?
• Is the reward-to-risk acceptable?
• Should position size be reduced?
WHAT THIS INDICATOR IS BEST FOR
━━━━━━━━━━━━━━━━━━━━━━
This indicator is best used for:
• Volatility-adjusted stop placement
• Trade risk planning
• Expected move-based target planning
• Position management
• Stop distance calibration
• Risk percentage monitoring
• High-volatility regime adjustment
• Avoiding random stop placement
• Improving reward-to-risk discipline
It is useful for traders who want stop placement to be linked to market conditions instead of fixed distances.
WHAT THIS INDICATOR IS NOT
━━━━━━━━━━━━━━━━━━━━━━
This indicator is not:
• A buy or sell signal generator
• A standalone trading strategy
• A guarantee that the stop will not be hit
• A prediction model
• A replacement for position sizing
• A replacement for market structure
• A complete trading system
The indicator tells you where a volatility-adjusted stop may be placed.
It does not tell you whether the trade should be entered.
IMPORTANT LIMITATIONS
━━━━━━━━━━━━━━━━━━━━━━
The indicator uses historical volatility and range behaviour.
It does not know future volatility.
Volatility can change rapidly after:
• Economic data releases
• Central bank decisions
• Earnings reports
• Geopolitical events
• Liquidity shocks
• Market opens and closes
• Crypto liquidation cascades
• Sudden order-flow imbalance
The indicator does not include:
• Options implied volatility
• Order flow
• Market depth
• Positioning data
• News sentiment
• Fundamental data
• Liquidity conditions
A volatility-based stop can still be hit during a normal adverse move.
It should be used with position sizing, trade invalidation logic, and market structure.
FINAL NOTES
━━━━━━━━━━━━━━━━━━━━━━
The Dynamic Stop-Loss Using Expected Move indicator helps traders convert volatility into practical risk levels.
Instead of asking only where support or resistance is, this tool helps answer:
• How far can price reasonably move against me?
• Is my stop too tight for current volatility?
• Is my stop too wide for the expected reward?
• Should my position size be reduced?
• Should the stop trail or stay fixed?
• Has volatility changed enough to alter my risk assumptions?
The indicator is designed to improve trade planning, stop discipline, and volatility-aware risk management.
开源脚本
秉承TradingView的精神,该脚本的作者将其开源,以便交易者可以查看和验证其功能。向作者致敬!您可以免费使用该脚本,但请记住,重新发布代码须遵守我们的网站规则。

免责声明
这些信息和出版物并非旨在提供,也不构成TradingView提供或认可的任何形式的财务、投资、交易或其他类型的建议或推荐。请阅读使用条款了解更多信息。
开源脚本
秉承TradingView的精神,该脚本的作者将其开源,以便交易者可以查看和验证其功能。向作者致敬!您可以免费使用该脚本,但请记住,重新发布代码须遵守我们的网站规则。
免责声明
这些信息和出版物并非旨在提供,也不构成TradingView提供或认可的任何形式的财务、投资、交易或其他类型的建议或推荐。请阅读使用条款了解更多信息。