Leverage Liquidation Projection
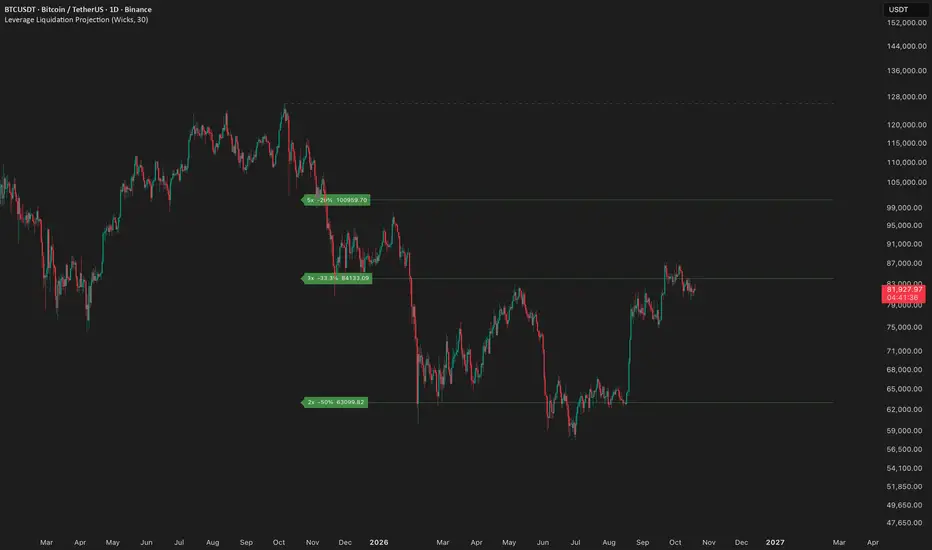
Leverage Liquidation Projection (LLP)
Overview
Leverage Liquidation Projection (LLP) plots theoretical liquidation levels for different leverage ratios based on the highest and lowest prices in the currently visible chart range.
How It Works
The indicator uses two reference points:
Liquidation levels are calculated using the selected leverage ratios. Higher leverage means a smaller price movement is required to reach the theoretical liquidation level.
Dynamic recalculation: The indicator automatically recalculates and updates all projected levels whenever the visible chart range changes, including when you zoom in, zoom out, or scroll through the chart.
Settings
Calculation Source
Long Liquidation Levels
Shows or hides projected long liquidation levels based on the visible high.
Short Liquidation Levels
Shows or hides projected short liquidation levels based on the visible low.
Leverage
Choose which leverage ratios to display, from 1x to 100x.
Show Reference Level
Toggles the dashed lines marking the reference high and low.
Show Labels
Toggles leverage and price labels.
Minimum Line Length, Bars
Sets the minimum horizontal length of projected levels.
Disclaimer
These are theoretical projections, not actual exchange liquidation data or exact liquidation prices. Real liquidation levels depend on entry price, margin mode, maintenance margin, fees, funding, and exchange-specific rules.
For analytical and educational purposes only. Not financial advice.
Overview
Leverage Liquidation Projection (LLP) plots theoretical liquidation levels for different leverage ratios based on the highest and lowest prices in the currently visible chart range.
How It Works
The indicator uses two reference points:
- High: Projects potential long liquidation levels below the visible high.
- Low: Projects potential short liquidation levels above the visible low.
Liquidation levels are calculated using the selected leverage ratios. Higher leverage means a smaller price movement is required to reach the theoretical liquidation level.
Dynamic recalculation: The indicator automatically recalculates and updates all projected levels whenever the visible chart range changes, including when you zoom in, zoom out, or scroll through the chart.
Settings
Calculation Source
- Wicks: Uses candle highs and lows, including wicks.
- Body: Uses candle body boundaries instead of wick extremes.
Long Liquidation Levels
Shows or hides projected long liquidation levels based on the visible high.
Short Liquidation Levels
Shows or hides projected short liquidation levels based on the visible low.
Leverage
Choose which leverage ratios to display, from 1x to 100x.
Show Reference Level
Toggles the dashed lines marking the reference high and low.
Show Labels
Toggles leverage and price labels.
Minimum Line Length, Bars
Sets the minimum horizontal length of projected levels.
Disclaimer
These are theoretical projections, not actual exchange liquidation data or exact liquidation prices. Real liquidation levels depend on entry price, margin mode, maintenance margin, fees, funding, and exchange-specific rules.
For analytical and educational purposes only. Not financial advice.

VMS://RACCOON — Cutting through the noise.
YouTube: youtube.com/@VMSRACCOON
Telegram: t.me/vms_raccoon
X: x.com/vms_raccoon
Not financial advice
YouTube: youtube.com/@VMSRACCOON
Telegram: t.me/vms_raccoon
X: x.com/vms_raccoon
Not financial advice
免责声明
这些信息和出版物并非旨在提供,也不构成TradingView提供或认可的任何形式的财务、投资、交易或其他类型的建议或推荐。请阅读使用条款了解更多信息。
VMS://RACCOON — Cutting through the noise.
YouTube: youtube.com/@VMSRACCOON
Telegram: t.me/vms_raccoon
X: x.com/vms_raccoon
Not financial advice
YouTube: youtube.com/@VMSRACCOON
Telegram: t.me/vms_raccoon
X: x.com/vms_raccoon
Not financial advice
免责声明
这些信息和出版物并非旨在提供,也不构成TradingView提供或认可的任何形式的财务、投资、交易或其他类型的建议或推荐。请阅读使用条款了解更多信息。