OPEN-SOURCE SCRIPT
C-Power
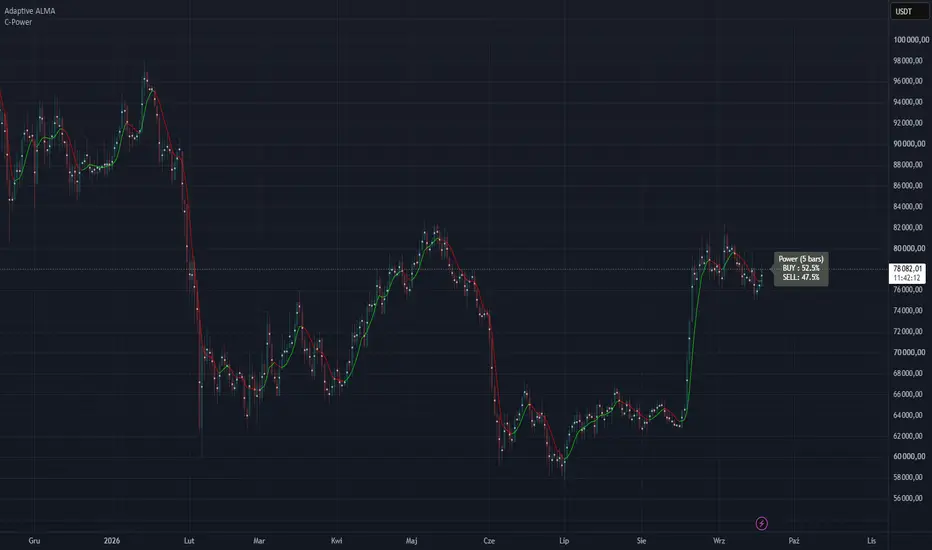
Indicator "C-Power" (candle buy/sell power) and is designed to dynamically measure and display the buying power (Buyers) and selling power (Sellers) over a specific period.
Simply put: the script analyzes recent candles and displays a small label on your chart showing who currently holds the upper hand in the market, along with their respective percentages.
How the Script Works (Step-by-Step)
1. Volume Filtering:
- The script retrieves market volume and smooths it using an ALMA (Arnaud Legoux Moving Average) over a selected period (5 candles by default).
- It protects the chart from anomalies – if an abrupt, massive volume spike occurs (over 3.5 times the average), the script "caps" it so that a single outlier does not distort the overall result.
2. Gap Protection:
- Instead of using just the raw highs and lows of the current candle, the script compares them with the closing price of the previous candle (prev_close). This ensures that price gaps are factored into the market's true momentum.
3. Garman-Klass Volatility Calculation (GK Volatility):
- This is the mathematical core of the script. It utilizes the advanced Garman-Klass formula, which measures market volatility based on the relationship between the open, high, low, and close prices.
- The result is further smoothed by the ALMA filter, delivering a highly stable representation of market volatility that is resilient against market noise.
4. Z-Score and Probability Estimation (Statistics):
- The script measures where the current price sits relative to the candle's midpoint and divides this by the calculated volatility. This creates a statistical value known as a Z-score.
- Using a built-in Cumulative Distribution Function for a normal distribution (normCDF via the error function erf), the script converts this score into a directional weight between 0 and 1. This weight represents the statistical probability of whether the move is inherently bullish or bearish.
5. Determining Final Power (Buy/Sell Power):
- If trading volume data is available for the asset, the script multiplies the volume by this calculated statistical weight.
- If volume data is unavailable (e.g., on certain indices or Forex pairs), the script relies entirely on the mathematical structure of the price action itself (hence the dynamic text update to GK Price).
- These accumulated values over the specified period (e.g., 5 candles) are then converted into percentages (e.g., BUY: 65.0% / SELL: 35.0%).
6. Chart Visualization:
- A text label is generated on the right side of the chart, shifted forward by a user-defined offset (3 candles by default).
- This label smoothly changes color (gradient) depending on who is dominating the market. If buyers have the upper hand, the label turns green (or your custom bullish color). If sellers take control, it turns red. It remains gray when the market is in balance.
Key Advantages of This Script:
- Versatility: It functions seamlessly both on markets with volume data (crypto, stocks) and markets without it (forex).
- Statistical Framework: Rather than guessing a trend based on simple logic like "the price is going up, so buy," it evaluates mathematical probability and volatility.
Conclusion – Overall, this is a dynamic indicator that utilizes mathematical estimations (Garman-Klass volatility, statistical Z-score, and probability distribution) to estimate the power of buyers and sellers over a selected candle lookback period.Typically, similar indicators fetch data from lower timeframes and rely on a simple logic: a red candle means a drop where sellers won, while a green candle means a rise where buyers won. They then simply aggregate the data and determine the buy/sell power based on the ratio of bullish to bearish candles.This indicator, however, attempts to reconstruct those same relationships mathematically on a single timeframe.Soon, I will release an oscillator that will serve as a historical complement to this indicator.
Simply put: the script analyzes recent candles and displays a small label on your chart showing who currently holds the upper hand in the market, along with their respective percentages.
How the Script Works (Step-by-Step)
1. Volume Filtering:
- The script retrieves market volume and smooths it using an ALMA (Arnaud Legoux Moving Average) over a selected period (5 candles by default).
- It protects the chart from anomalies – if an abrupt, massive volume spike occurs (over 3.5 times the average), the script "caps" it so that a single outlier does not distort the overall result.
2. Gap Protection:
- Instead of using just the raw highs and lows of the current candle, the script compares them with the closing price of the previous candle (prev_close). This ensures that price gaps are factored into the market's true momentum.
3. Garman-Klass Volatility Calculation (GK Volatility):
- This is the mathematical core of the script. It utilizes the advanced Garman-Klass formula, which measures market volatility based on the relationship between the open, high, low, and close prices.
- The result is further smoothed by the ALMA filter, delivering a highly stable representation of market volatility that is resilient against market noise.
4. Z-Score and Probability Estimation (Statistics):
- The script measures where the current price sits relative to the candle's midpoint and divides this by the calculated volatility. This creates a statistical value known as a Z-score.
- Using a built-in Cumulative Distribution Function for a normal distribution (normCDF via the error function erf), the script converts this score into a directional weight between 0 and 1. This weight represents the statistical probability of whether the move is inherently bullish or bearish.
5. Determining Final Power (Buy/Sell Power):
- If trading volume data is available for the asset, the script multiplies the volume by this calculated statistical weight.
- If volume data is unavailable (e.g., on certain indices or Forex pairs), the script relies entirely on the mathematical structure of the price action itself (hence the dynamic text update to GK Price).
- These accumulated values over the specified period (e.g., 5 candles) are then converted into percentages (e.g., BUY: 65.0% / SELL: 35.0%).
6. Chart Visualization:
- A text label is generated on the right side of the chart, shifted forward by a user-defined offset (3 candles by default).
- This label smoothly changes color (gradient) depending on who is dominating the market. If buyers have the upper hand, the label turns green (or your custom bullish color). If sellers take control, it turns red. It remains gray when the market is in balance.
Key Advantages of This Script:
- Versatility: It functions seamlessly both on markets with volume data (crypto, stocks) and markets without it (forex).
- Statistical Framework: Rather than guessing a trend based on simple logic like "the price is going up, so buy," it evaluates mathematical probability and volatility.
Conclusion – Overall, this is a dynamic indicator that utilizes mathematical estimations (Garman-Klass volatility, statistical Z-score, and probability distribution) to estimate the power of buyers and sellers over a selected candle lookback period.Typically, similar indicators fetch data from lower timeframes and rely on a simple logic: a red candle means a drop where sellers won, while a green candle means a rise where buyers won. They then simply aggregate the data and determine the buy/sell power based on the ratio of bullish to bearish candles.This indicator, however, attempts to reconstruct those same relationships mathematically on a single timeframe.Soon, I will release an oscillator that will serve as a historical complement to this indicator.
开源脚本
秉承TradingView的精神,该脚本的作者将其开源,以便交易者可以查看和验证其功能。向作者致敬!您可以免费使用该脚本,但请记住,重新发布代码须遵守我们的网站规则。

免责声明
这些信息和出版物并非旨在提供,也不构成TradingView提供或认可的任何形式的财务、投资、交易或其他类型的建议或推荐。请阅读使用条款了解更多信息。
免责声明
这些信息和出版物并非旨在提供,也不构成TradingView提供或认可的任何形式的财务、投资、交易或其他类型的建议或推荐。请阅读使用条款了解更多信息。