MTF Supply & Demand (PropFirmGorilla)
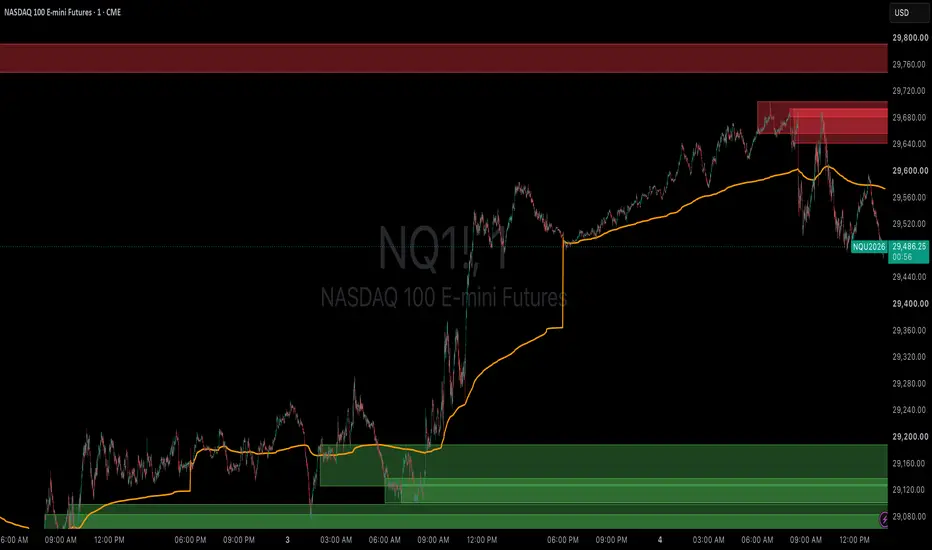
This indicator detects supply and demand zones across eight timeframes at once — 15m, 30m, 1H, 90m, 2H, 4H, 690m and Daily — and draws them on whatever chart you're viewing, so you don't have to flip timeframes to map higher-timeframe levels.
How a zone is found
Each zone is built from an impulse candle and the basing candle immediately before it:
A zone is removed automatically once price trades back through it (through the zone low for demand, the zone high for supply), so the chart only shows levels that are still unmirrored.
Non-repainting
Higher-timeframe zones are read from closed bars only (confirmed history, no lookahead), so a zone appears after its impulse candle closes and does not repaint on reload.
Features:
How to use
Add it to any chart. Zones from all enabled timeframes appear as colored areas extended to the right. Treat demand zones as potential support and supply zones as potential resistance; a zone disappears once price closes through it. Tune the detection inputs to match the instrument's volatility, and enable Simplify Zones on lower timeframes where many zones stack up.
Inputs
Notes
This tool is for chart analysis and education only. It is not financial advice; test any approach before trading it.
How a zone is found
Each zone is built from an impulse candle and the basing candle immediately before it:
- Demand: a bullish impulse candle that moves up at least a set % (open→close) and closes in the top portion of its range, preceded by a small down-closing basing candle whose body is no larger than a set % of the impulse body. The zone runs from the basing candle's open down to its low.
- Supply: the mirror — a bearish impulse that closes near its low, preceded by a small up-closing basing candle. The zone runs from the basing candle's high down to its open.
A zone is removed automatically once price trades back through it (through the zone low for demand, the zone high for supply), so the chart only shows levels that are still unmirrored.
Non-repainting
Higher-timeframe zones are read from closed bars only (confirmed history, no lookahead), so a zone appears after its impulse candle closes and does not repaint on reload.
Features:
- 8 timeframes, each toggled on/off independently.
- Simplify Zones: when same-side zones overlap, merge them into one rectangle labeled with every timeframe involved (e.g. "90m / 30m / 15m") to reduce clutter.
- Box or line display: filled zones, or a single line at each zone's origin.
- Separate colors and adjustable opacity for demand vs supply.
- Each zone is labeled with its timeframe.
- Adjustable detection thresholds (impulse move %, close-in-range %, basing body %) and a cap on zones per timeframe.
How to use
Add it to any chart. Zones from all enabled timeframes appear as colored areas extended to the right. Treat demand zones as potential support and supply zones as potential resistance; a zone disappears once price closes through it. Tune the detection inputs to match the instrument's volatility, and enable Simplify Zones on lower timeframes where many zones stack up.
Inputs
- Zone Detection: Impulse min move (%), Impulse close in range (%), Basing body max vs impulse (%), Max zones per timeframe.
- Timeframes: 15m / 30m / 1H / 90m / 2H / 4H / 690m / Daily.
- Appearance: Show demand / Show supply, Demand & Supply colors, Fill opacity, Fill boxes (off = origin line only), Simplify Zones, Show timeframe label.
Notes
- 90m and 690m are requested as custom minute resolutions; if your plan or symbol doesn't return one, untick that timeframe.
- Higher-timeframe zones need that timeframe's history to be available; extend the chart's loaded history if a timeframe looks sparse.
This tool is for chart analysis and education only. It is not financial advice; test any approach before trading it.

The best prop firm plan comparison tool: propfirmgorilla.com
免责声明
这些信息和出版物并非旨在提供,也不构成TradingView提供或认可的任何形式的财务、投资、交易或其他类型的建议或推荐。请阅读使用条款了解更多信息。
The best prop firm plan comparison tool: propfirmgorilla.com
免责声明
这些信息和出版物并非旨在提供,也不构成TradingView提供或认可的任何形式的财务、投资、交易或其他类型的建议或推荐。请阅读使用条款了解更多信息。