已更新
Tweezers Top & Bottom Detection Rev1
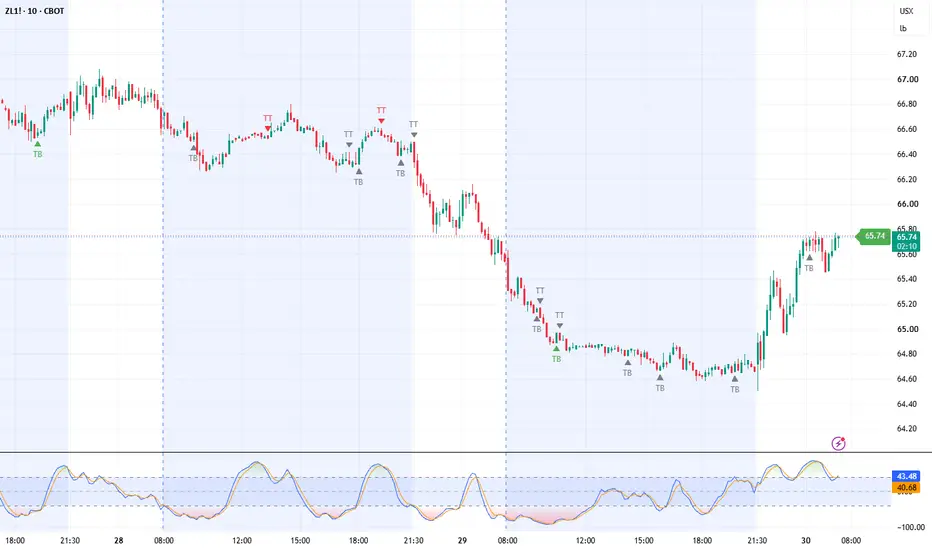
Description
The Precise Tweezers Top & Bottom indicator is designed to detect high-probability candlestick reversal patterns with real-world precision.
While basic Tweezer indicators demand an exact price match (which is rare in live, volatile markets), this script was built with practical trading in mind. It introduces a Tick Tolerance threshold, alongside optional Trend and Volume confirmations, to help you filter out market noise and focus on high-quality setups.
🔍 What is a Tweezer Pattern?
A Tweezer pattern is a two-candle reversal formation that indicates a potential shift in market momentum:
Tweezer Bottom (TB): A bearish (red) candle followed by a bullish (green) candle with matching lows. It signifies that sellers pushed the price down to a specific level, but buyers forcefully rejected it.
Tweezer Top (TT): A bullish (green) candle followed by a bearish (red) candle with matching highs. It signifies that buyers pushed the price up, but sellers aggressively defended that level.
🛠️ Key Features
This indicator goes beyond standard candlestick pattern recognition by offering several layers of customizable filtering:
Allowed Ticks Threshold: Markets are rarely pixel-perfect. You can set a tick tolerance (e.g., 0 to 5 ticks) to catch valid reversal patterns where the highs or lows match very closely, but not exactly. Set to 0 for strict, exact price matches.
Volume Confirmation: When enabled, the indicator verifies that the second candle (the reversal candle) has a higher trading volume than the first candle. This confirms that there is strong market participation behind the rejection.
Trend Filtering (EMA): Counter-trend trading can be risky. By enabling the EMA filter, Tweezer Bottoms will only trigger in a broader downtrend (price below EMA), and Tweezer Tops will only trigger in a broader uptrend (price above EMA).
Minimum Timeframe Filter: Automatically hides visual signals and mutes alerts on lower timeframes (e.g., under 5 minutes) to prevent over-trading on intraday market noise.
Clean Chart UI: Easily toggle the "TB" and "TT" text, triangle shapes, and the EMA line on or off to keep your charts looking exactly how you want them.
🔔 Built for Automation & Alerts
This script is fully optimized for mobile notifications and webhook automations (like n8n, PineConnector, or TradersPost). It includes dynamic alert messages that capture the exact price and timestamp of the reversal.
Create specific alerts for Tweezer Tops or Tweezer Bottoms individually.
Or, use the Combined "TB and TT Formed" option to monitor for any Tweezer reversal using a single alert slot.
⚙️ How to Use:
Add the indicator to your chart.
Open the Settings (gear icon) to adjust your Tick Threshold based on the asset you are trading (Forex, Crypto, Futures, etc.).
Toggle the Volume or Trend filters if you want stricter entry criteria.
Set up alerts via the TradingView alert menu.
Disclaimer: Candlestick patterns are most effective when combined with other forms of technical analysis, such as Support/Resistance zones, Order Blocks, or Volume Profile. Past performance does not guarantee future results.
The Precise Tweezers Top & Bottom indicator is designed to detect high-probability candlestick reversal patterns with real-world precision.
While basic Tweezer indicators demand an exact price match (which is rare in live, volatile markets), this script was built with practical trading in mind. It introduces a Tick Tolerance threshold, alongside optional Trend and Volume confirmations, to help you filter out market noise and focus on high-quality setups.
🔍 What is a Tweezer Pattern?
A Tweezer pattern is a two-candle reversal formation that indicates a potential shift in market momentum:
Tweezer Bottom (TB): A bearish (red) candle followed by a bullish (green) candle with matching lows. It signifies that sellers pushed the price down to a specific level, but buyers forcefully rejected it.
Tweezer Top (TT): A bullish (green) candle followed by a bearish (red) candle with matching highs. It signifies that buyers pushed the price up, but sellers aggressively defended that level.
🛠️ Key Features
This indicator goes beyond standard candlestick pattern recognition by offering several layers of customizable filtering:
Allowed Ticks Threshold: Markets are rarely pixel-perfect. You can set a tick tolerance (e.g., 0 to 5 ticks) to catch valid reversal patterns where the highs or lows match very closely, but not exactly. Set to 0 for strict, exact price matches.
Volume Confirmation: When enabled, the indicator verifies that the second candle (the reversal candle) has a higher trading volume than the first candle. This confirms that there is strong market participation behind the rejection.
Trend Filtering (EMA): Counter-trend trading can be risky. By enabling the EMA filter, Tweezer Bottoms will only trigger in a broader downtrend (price below EMA), and Tweezer Tops will only trigger in a broader uptrend (price above EMA).
Minimum Timeframe Filter: Automatically hides visual signals and mutes alerts on lower timeframes (e.g., under 5 minutes) to prevent over-trading on intraday market noise.
Clean Chart UI: Easily toggle the "TB" and "TT" text, triangle shapes, and the EMA line on or off to keep your charts looking exactly how you want them.
🔔 Built for Automation & Alerts
This script is fully optimized for mobile notifications and webhook automations (like n8n, PineConnector, or TradersPost). It includes dynamic alert messages that capture the exact price and timestamp of the reversal.
Create specific alerts for Tweezer Tops or Tweezer Bottoms individually.
Or, use the Combined "TB and TT Formed" option to monitor for any Tweezer reversal using a single alert slot.
⚙️ How to Use:
Add the indicator to your chart.
Open the Settings (gear icon) to adjust your Tick Threshold based on the asset you are trading (Forex, Crypto, Futures, etc.).
Toggle the Volume or Trend filters if you want stricter entry criteria.
Set up alerts via the TradingView alert menu.
Disclaimer: Candlestick patterns are most effective when combined with other forms of technical analysis, such as Support/Resistance zones, Order Blocks, or Volume Profile. Past performance does not guarantee future results.
版本注释
Minor updates - SMI filtering.版本注释
Chart update.
免责声明
这些信息和出版物并非旨在提供,也不构成TradingView提供或认可的任何形式的财务、投资、交易或其他类型的建议或推荐。请阅读使用条款了解更多信息。
免责声明
这些信息和出版物并非旨在提供,也不构成TradingView提供或认可的任何形式的财务、投资、交易或其他类型的建议或推荐。请阅读使用条款了解更多信息。