OPEN-SOURCE SCRIPT
已更新 Liquidity Strain Detector [MarkitTick]
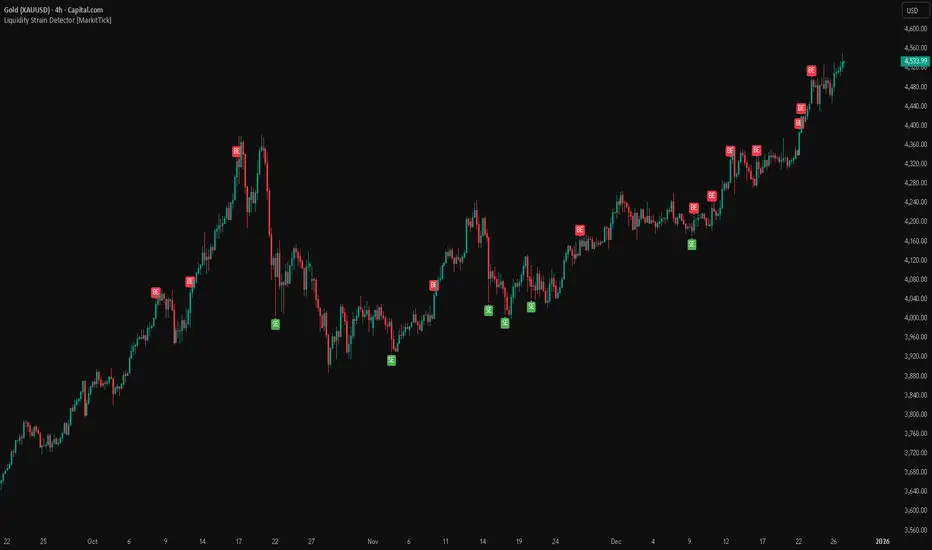
💡 This indicator provides a specialized method for detecting market anomalies where price movement becomes disconnected from typical volume profiles, signaling potential exhaustion events. By combining statistical analysis of liquidity (price impact) with a directional trend filter, the tool aims to highlight moments of extreme market stress, such as panic selling or euphoric buying, that often precede mean reversions or trend pauses.
● Originality and Utility
Standard volume indicators often look at raw volume levels, which can be misleading during different times of the day or across different assets. This script calculates the efficiency of moving price (Illiquidity) and normalizes it statistically. This allows the trader to see when the market is becoming thin or stressed relative to recent history. It is particularly useful for contrarian traders looking for capitulation points within established trends, offering a unique perspective beyond standard RSI or MACD divergence.
● Methodology
The core mechanism drives a custom Liquidity Engine that performs the following steps:
● How to Use
The indicator plots labels on the chart when specific High Stress conditions are met during a trend:
● Inputs
● Disclaimer
All provided scripts and indicators are strictly for educational exploration and must not be interpreted as financial advice or a recommendation to execute trades. I expressly disclaim all liability for any financial losses or damages that may result, directly or indirectly, from the reliance on or application of these tools. Market participation carries inherent risk where past performance never guarantees future returns, leaving all investment decisions and due diligence solely at your own discretion.
● Originality and Utility
Standard volume indicators often look at raw volume levels, which can be misleading during different times of the day or across different assets. This script calculates the efficiency of moving price (Illiquidity) and normalizes it statistically. This allows the trader to see when the market is becoming thin or stressed relative to recent history. It is particularly useful for contrarian traders looking for capitulation points within established trends, offering a unique perspective beyond standard RSI or MACD divergence.
● Methodology
The core mechanism drives a custom Liquidity Engine that performs the following steps:
- Price Impact Calculation: It computes the ratio of the True Range to Volume. High values indicate that price is moving significant distances on relatively low volume or that volatility is extreme relative to participation.
- Normalization: The raw impact data is smoothed using a logarithmic scale to handle the wide variance in volume data.
- Statistical Scoring (Z-Score): The script calculates the Z-Score of this normalized data over a user-defined lookback period. This determines how many standard deviations the current liquidity stress is away from the mean.
- Trend Filtering: A standard Exponential Moving Average (EMA) determines the dominant market direction to contextualize the stress signal.
● How to Use
The indicator plots labels on the chart when specific High Stress conditions are met during a trend:
- SE (Seller Exhaustion - Green Label): Appears when the market is in a downtrend (price below EMA), the current candle is bearish, and the liquidity stress Z-Score breaches the upper threshold. This suggests panic selling or a liquidity gap down, often marking a temporary bottom or reversal point.
- BE (Buyer Exhaustion - Red Label): Appears when the market is in an uptrend (price above EMA), the current candle is bullish, and the liquidity stress Z-Score breaches the upper threshold. This suggests a melt-up or buying climax into thin liquidity, often preceding a pullback.
● Inputs
- Trend Filter Length: The period for the EMA used to determine the baseline trend direction.
- Statistical Lookback: The number of bars used to calculate the mean and standard deviation for the Z-Score.
- Stress Threshold (Sigma): The Z-Score value required to trigger a high-stress signal. Higher values result in fewer, more extreme signals.
● Disclaimer
All provided scripts and indicators are strictly for educational exploration and must not be interpreted as financial advice or a recommendation to execute trades. I expressly disclaim all liability for any financial losses or damages that may result, directly or indirectly, from the reliance on or application of these tools. Market participation carries inherent risk where past performance never guarantees future returns, leaving all investment decisions and due diligence solely at your own discretion.
版本注释
Implemented a strict state management engine with dynamic ATR-based Stop Loss and Take Profit to track active trades and invalidate setups.Integrated a robust JSON webhook alerting architecture utilizing str.format() for precise, tick-accurate entry and closure API payloads.
开源脚本
秉承TradingView的精神,该脚本的作者将其开源,以便交易者可以查看和验证其功能。向作者致敬!您可以免费使用该脚本,但请记住,重新发布代码须遵守我们的网站规则。

💡 Proprietary indicators. Original research. Built by analysts who trade.
📢 Free Telegram: t.me/MarkitTick_Updates
👑 Premium: TradingView Marketplace
📘 Guides: markittick.com
📢 Free Telegram: t.me/MarkitTick_Updates
👑 Premium: TradingView Marketplace
📘 Guides: markittick.com
免责声明
这些信息和出版物并非旨在提供,也不构成TradingView提供或认可的任何形式的财务、投资、交易或其他类型的建议或推荐。请阅读使用条款了解更多信息。
开源脚本
秉承TradingView的精神,该脚本的作者将其开源,以便交易者可以查看和验证其功能。向作者致敬!您可以免费使用该脚本,但请记住,重新发布代码须遵守我们的网站规则。
💡 Proprietary indicators. Original research. Built by analysts who trade.
📢 Free Telegram: t.me/MarkitTick_Updates
👑 Premium: TradingView Marketplace
📘 Guides: markittick.com
📢 Free Telegram: t.me/MarkitTick_Updates
👑 Premium: TradingView Marketplace
📘 Guides: markittick.com
免责声明
这些信息和出版物并非旨在提供,也不构成TradingView提供或认可的任何形式的财务、投资、交易或其他类型的建议或推荐。请阅读使用条款了解更多信息。