OPEN-SOURCE SCRIPT
Market Correlation Matrix [NikaQuant]
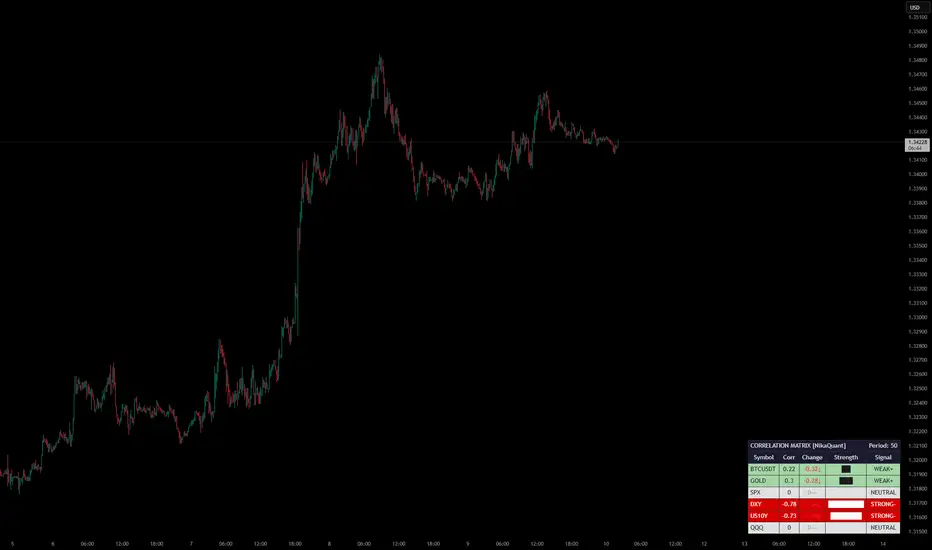
Market Correlation Matrix [NikaQuant]
A real-time correlation dashboard that displays Pearson correlation coefficients between the current chart symbol and up to 6 user-defined comparison symbols.
═══ FEATURES ═══
• Track correlations for up to 6 symbols simultaneously (default: BTCUSDT, GOLD, SPX, DXY, US10Y, QQQ)
• Heatmap-colored table with intuitive color coding from strong positive (green) to strong negative (red)
• Correlation change tracking — see how correlations are shifting over a configurable lookback period
• Visual strength bars showing absolute correlation magnitude at a glance
• Signal classification labels: STRONG+/-, MOD+/-, WEAK+/-, NEUTRAL
• Built-in alerts for strong positive/negative crosses (±0.7) and zero-line crosses
• Fully customizable: table position, text size, all colors, border styling
═══ HOW IT WORKS ═══
The indicator calculates Pearson correlation over a user-defined period (default: 50 bars) between the chart’s close price and each comparison symbol’s close price. It then renders a compact table showing:
1. Symbol — Ticker of the comparison asset
2. Corr — Current correlation value (-1 to +1)
3. Change — How much the correlation shifted vs N bars ago (with directional arrows)
4. Strength — Block-style visual bar representing absolute correlation
5. Signal — Classification from NEUTRAL to STRONG+/-
═══ SETTINGS ═══
Symbols: Configure up to 6 comparison symbols (leave blank to skip)
Correlation Period: Lookback length for Pearson calculation (default: 50)
Change Lookback: Compare current vs past correlation (default: 10 bars)
Display: Table position, show/hide title
Style: Full color customization for heatmap, headers, borders, and change indicators
═══ ALERTS ═══
• Strong positive correlation cross (above +0.7) per symbol
• Strong negative correlation cross (below -0.7) per symbol
• Any symbol crossing the zero line
═══ USE CASES ═══
• Monitor intermarket relationships in real time
• Identify regime changes when correlations break down or strengthen
• Confirm or filter trade setups using cross-asset correlation context
• Track USD, bonds, equities, and crypto correlations from a single chart
A real-time correlation dashboard that displays Pearson correlation coefficients between the current chart symbol and up to 6 user-defined comparison symbols.
═══ FEATURES ═══
• Track correlations for up to 6 symbols simultaneously (default: BTCUSDT, GOLD, SPX, DXY, US10Y, QQQ)
• Heatmap-colored table with intuitive color coding from strong positive (green) to strong negative (red)
• Correlation change tracking — see how correlations are shifting over a configurable lookback period
• Visual strength bars showing absolute correlation magnitude at a glance
• Signal classification labels: STRONG+/-, MOD+/-, WEAK+/-, NEUTRAL
• Built-in alerts for strong positive/negative crosses (±0.7) and zero-line crosses
• Fully customizable: table position, text size, all colors, border styling
═══ HOW IT WORKS ═══
The indicator calculates Pearson correlation over a user-defined period (default: 50 bars) between the chart’s close price and each comparison symbol’s close price. It then renders a compact table showing:
1. Symbol — Ticker of the comparison asset
2. Corr — Current correlation value (-1 to +1)
3. Change — How much the correlation shifted vs N bars ago (with directional arrows)
4. Strength — Block-style visual bar representing absolute correlation
5. Signal — Classification from NEUTRAL to STRONG+/-
═══ SETTINGS ═══
Symbols: Configure up to 6 comparison symbols (leave blank to skip)
Correlation Period: Lookback length for Pearson calculation (default: 50)
Change Lookback: Compare current vs past correlation (default: 10 bars)
Display: Table position, show/hide title
Style: Full color customization for heatmap, headers, borders, and change indicators
═══ ALERTS ═══
• Strong positive correlation cross (above +0.7) per symbol
• Strong negative correlation cross (below -0.7) per symbol
• Any symbol crossing the zero line
═══ USE CASES ═══
• Monitor intermarket relationships in real time
• Identify regime changes when correlations break down or strengthen
• Confirm or filter trade setups using cross-asset correlation context
• Track USD, bonds, equities, and crypto correlations from a single chart
开源脚本
秉承TradingView的精神,该脚本的作者将其开源,以便交易者可以查看和验证其功能。向作者致敬!您可以免费使用该脚本,但请记住,重新发布代码须遵守我们的网站规则。

免责声明
这些信息和出版物并非旨在提供,也不构成TradingView提供或认可的任何形式的财务、投资、交易或其他类型的建议或推荐。请阅读使用条款了解更多信息。
免责声明
这些信息和出版物并非旨在提供,也不构成TradingView提供或认可的任何形式的财务、投资、交易或其他类型的建议或推荐。请阅读使用条款了解更多信息。