OPEN-SOURCE SCRIPT
Elaris 1D High-Low Boxes Pro
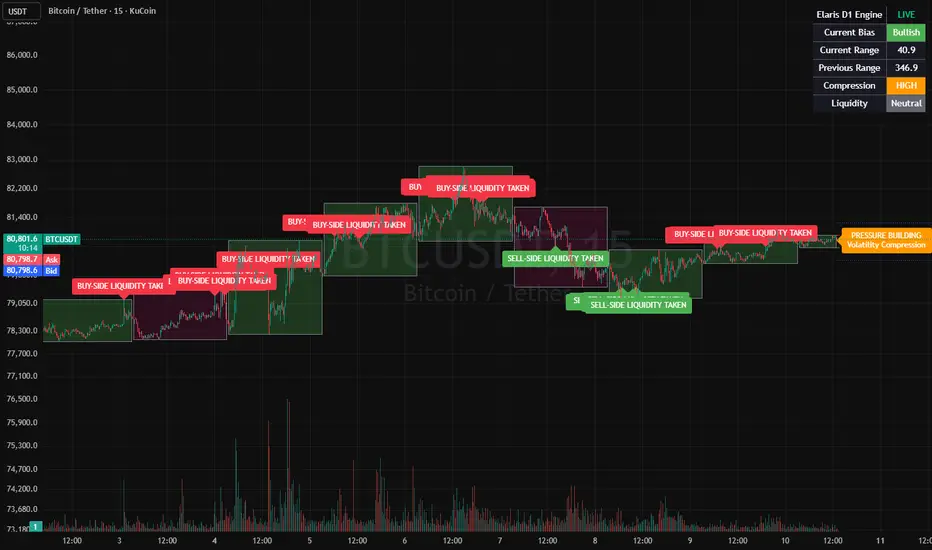
# Elaris 1D High-Low Boxes Pro
This indicator was built around a simple idea:
Higher timeframe ranges often control intraday price behavior more than most traders realize.
The script maps Daily range activity directly onto lower timeframes and focuses on how price reacts around previous highs, lows, compression zones, and liquidity areas during the session.
Instead of plotting static support/resistance levels, the indicator continuously tracks the active Daily range and updates its structure in real time as the session develops.
Main features included in the script:
• Dynamic Daily high-low boxes
• Previous Daily high/low projections
• Liquidity sweep detection
• Volatility compression detection
• Expansion projection levels
• Market condition dashboard
• Bullish/Bearish range visualization
The liquidity sweep logic is designed to highlight situations where price trades above or below a previous Daily level and quickly reclaims the range. These areas can sometimes provide useful context for reversals, failed breakouts, or continuation setups.
The compression engine monitors decreasing Daily ranges and attempts to identify periods where volatility is contracting before expansion. When compression conditions appear, the script labels the chart to indicate potential pressure buildup.
Projected expansion zones are calculated using previous Daily range behavior and can be used as reference areas during breakout conditions.
Recommended usage:
* Intraday trading
* Scalping
* Session trading
* Market structure analysis
* Liquidity-based trading models
Recommended chart timeframes:
* 5m
* 15m
* 30m
* 1H
The script is intended as a market context and visualization tool rather than a standalone trading system.
Built by ElarisGroup.
This indicator was built around a simple idea:
Higher timeframe ranges often control intraday price behavior more than most traders realize.
The script maps Daily range activity directly onto lower timeframes and focuses on how price reacts around previous highs, lows, compression zones, and liquidity areas during the session.
Instead of plotting static support/resistance levels, the indicator continuously tracks the active Daily range and updates its structure in real time as the session develops.
Main features included in the script:
• Dynamic Daily high-low boxes
• Previous Daily high/low projections
• Liquidity sweep detection
• Volatility compression detection
• Expansion projection levels
• Market condition dashboard
• Bullish/Bearish range visualization
The liquidity sweep logic is designed to highlight situations where price trades above or below a previous Daily level and quickly reclaims the range. These areas can sometimes provide useful context for reversals, failed breakouts, or continuation setups.
The compression engine monitors decreasing Daily ranges and attempts to identify periods where volatility is contracting before expansion. When compression conditions appear, the script labels the chart to indicate potential pressure buildup.
Projected expansion zones are calculated using previous Daily range behavior and can be used as reference areas during breakout conditions.
Recommended usage:
* Intraday trading
* Scalping
* Session trading
* Market structure analysis
* Liquidity-based trading models
Recommended chart timeframes:
* 5m
* 15m
* 30m
* 1H
The script is intended as a market context and visualization tool rather than a standalone trading system.
Built by ElarisGroup.
开源脚本
秉承TradingView的精神,该脚本的作者将其开源,以便交易者可以查看和验证其功能。向作者致敬!您可以免费使用该脚本,但请记住,重新发布代码须遵守我们的网站规则。

免责声明
这些信息和出版物并非旨在提供,也不构成TradingView提供或认可的任何形式的财务、投资、交易或其他类型的建议或推荐。请阅读使用条款了解更多信息。
开源脚本
秉承TradingView的精神,该脚本的作者将其开源,以便交易者可以查看和验证其功能。向作者致敬!您可以免费使用该脚本,但请记住,重新发布代码须遵守我们的网站规则。
免责声明
这些信息和出版物并非旨在提供,也不构成TradingView提供或认可的任何形式的财务、投资、交易或其他类型的建议或推荐。请阅读使用条款了解更多信息。