OPEN-SOURCE SCRIPT
QYRO Adaptive Regime
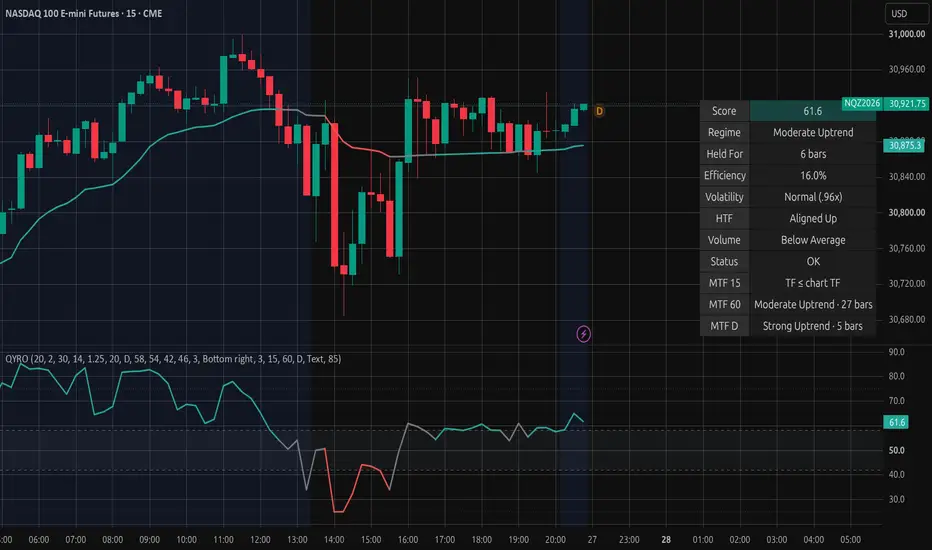
Qyro Adaptive Regime classifies every bar into one of five market regimes and scores the strength of the current direction from 0 to 100. It is built to answer one question clearly and consistently: is this market trending, and how cleanly?
The regime is held with hysteresis and a minimum duration, so it stays stable instead of flipping on every small move, and a built-in dashboard shows the same reading for three other timeframes at once. Qyro is a context tool for your own analysis. It does not generate entry or exit signals.
KEY FEATURES
- Composite 0-100 score built from six market readings
- Five regimes: Strong Uptrend, Moderate Uptrend, Range / Low Directionality, Moderate Downtrend, Strong Downtrend
- Hysteresis and a 3-bar minimum hold for stable, readable labels
- Multi-timeframe dashboard (15m, 1H and 1D by default) calculated from completed bars
- Adaptive trend line on the price chart and score history in its own pane
- Six alerts for regime and volatility changes, with optional JSON output for webhooks
- Built-in status checks for warmup, missing volume data and timeframe settings
HOW THE SCORE IS BUILT
Each reading is converted to a 0-100 scale, where 50 is neutral. The six readings are then combined with fixed weights.
1. Path efficiency (25%)
How directly price has travelled over the last 20 bars: the net move divided by the total distance covered, signed by direction. A straight rise reads 100, a straight decline reads 0, and choppy sideways movement reads 50.
Reading: 50 + 50 × efficiency ratio × direction of the net move.
2. Adaptive trend slope (25%)
The one-bar change of a Kaufman Adaptive Moving Average (fast 2, slow 30), measured in ATR(14) units. The average speeds up when price moves efficiently and slows down in chop, so its slope reflects the quality of the trend as well as its direction.
Reading: 50 + 220 × (change in the average / ATR), limited to 0-100.
3. Price location (22%)
Where the close sits relative to the adaptive average, measured in ATR units.
Reading: 50 + 25 × ((close - average) / ATR), limited to 0-100.
4. Volatility state (13%)
ATR(14) compared with its own 56-bar average. Above 1.25 times that average the state is Expanded, below 0.85 times it is Contracted, and otherwise it is Normal.
Reading: 68 when volatility expands with price above a rising average, 32 when it expands with price below a falling average, 45 when it expands without a clear trend, 58 in normal conditions and 52 when contracted.
5. Relative volume (7%)
Current volume compared with its 20-bar average.
Reading: 40 + 20 × relative volume, limited to 0-100. Neutral (50) when the symbol has no volume data.
6. Higher-timeframe alignment (8%)
The previous completed bar of a higher timeframe (daily by default).
Reading: 75 if it closed above its own adaptive average with that average rising, 25 if it closed below with the average falling, and 50 otherwise.
HOW THE REGIME IS DETERMINED
- Uptrend begins when the score reaches 58 and ends only when it falls below 54.
- Downtrend begins when the score reaches 42 and ends only when it rises above 46.
- Strong labels apply at 75 and 25, with the same 4-point margin.
- Range / Low Directionality covers everything in between.
- Every regime must hold for at least 3 bars before it can change.
The gap between the entry and exit levels (hysteresis) keeps the label from flickering when the score hovers near a threshold. The indicator needs 69 bars of history before it displays a reading; until then, the dashboard shows how many bars remain.
WHY COMBINE THESE READINGS
Each reading answers a different question about the same move: how clean the path is (efficiency), where price is heading and where it sits (slope and location), whether the move is expanding (volatility), whether participation supports it (volume) and whether the larger timeframe agrees (higher-timeframe alignment). On its own, each answers only one of these questions. Qyro combines them into a single weighted score, stabilizes the result with hysteresis and a minimum hold, and reads every higher timeframe from completed bars only. The source code is open, so every calculation can be reviewed.
MULTI-TIMEFRAME DASHBOARD
Three configurable rows (15 minutes, 1 hour and 1 day by default) show the regime and the number of bars it has held on each timeframe, using the same formula, hysteresis and minimum hold. Each row reflects the last completed bar of its timeframe, which is what that timeframe's own chart showed one bar earlier. A row set to a timeframe at or below the chart's timeframe is marked as such.
ALERTS
Six alert conditions fire once per bar close: the regime changing to Uptrend, Downtrend or Range, and volatility changing to Expanded, Contracted or Normal. These are state changes, not trade signals.
With "Any alert() function call", the same events can be sent as plain text or, with Alert Payload Format set to JSON, as a single-line JSON object containing the event, ticker, interval, regime, score, bars held, higher-timeframe state, volatility state and bar time (UTC).
HOW TO USE IT
- Use it as market context alongside your own method, not as an entry trigger.
- Check whether the 15-minute, 1-hour and daily regimes agree before forming a directional view.
- The measurements below are for regular trading hours. On extended-session charts, expect more frequent regime changes.
- On daily charts, set Higher Timeframe to W. With the default D, that component stays neutral, and the dashboard says so.
MEASURED BEHAVIOR
Tested with default settings on MES futures, regular trading hours, 2019-2023:
- Regime changes: about 8 per session on 5-minute charts, 2.6 on 15-minute charts and 0.7 on 1-hour charts. A regime lasts a median of 5-6 bars; one in ten lasts 22-23 bars or longer.
- Stability: hysteresis and the minimum hold remove about 40% of the changes a simple threshold would produce. Widening the exit margin to 8 or 12 points reduces 5-minute changes to 6.1 or 4.5 per session.
- Responsiveness: after the 20-bar return changes direction, the matching regime appears a median of 7-8 bars later. Under the same rules, that is slower than an EMA(20) slope (6 bars) and faster than an ADX(14) filter (32 bars). Qyro changes regime less often than the EMA slope (7.8 vs 10.1 per 5-minute session) and more often than the ADX filter (3.2).
- Consistency: across 2019-2023, including the volatile years 2020 and 2022, regime changes per session varied by less than 9% between the calmest and the most volatile year on every timeframe.
- Not predictive: the regime's direction matched the direction of the next 20 bars 51-53% of the time, close to an EMA(20) slope (50.5-52%) and to ADX(14) with DI direction (50-51%). No regime label was followed by a statistically reliable return in its own direction, and in that rising market, bars labelled Downtrend were followed by average gains in almost every case.
OTHER MARKETS
Tested with default settings, without any tuning, on daily and hourly data for SPY, QQQ, AAPL, TSLA, ES, gold, crude oil, EURUSD, USDJPY, BTC and ETH:
- 9.6-11.4 regime changes per 100 bars on all 22 symbol and timeframe combinations, between an EMA(20) slope (11.5-14.2) and an ADX(14) filter (3.8-5.7).
- The matching regime appeared a median of 6-10 bars after the 20-bar return changed direction.
- Directional agreement with the next 20 bars ranged from 46% to 58%, in line with both benchmarks.
- On forex symbols without volume data, the volume component switches to neutral automatically.
SETTINGS
Every input has a tooltip. Defaults:
- Efficiency length 20; adaptive average fast 2 and slow 30; ATR 14; volatility expansion threshold 1.25
- Volume length 20; higher timeframe D
- Uptrend enter/exit 58/54; downtrend enter/exit 42/46; minimum hold 3 bars
- Dashboard rows 15, 60 and D; alert payload Text; background tint off
- Signed efficiency on (turn it off for the classic, directionless efficiency ratio)
Invalid combinations are corrected automatically and reported in the dashboard's status row: a slow length at or below the fast length is raised to fast + 1, and exit levels outside the entry levels are clamped to them.
LIMITATIONS
- Qyro describes the current market. It does not forecast it, and it is not a trading system.
- The measurements come from regular-hours MES data and public daily and hourly data. Other sessions and data feeds will behave differently.
- On 1-hour charts, the delay in confirming a new direction varies with volatility: its average rose from 12.5 bars in 2019 to 22.3 bars in 2020.
- No reading is shown for the first 69 bars.
- On Heikin Ashi, Renko and other synthetic chart types, the status row reports that the score is not meaningful.
- The slope and price-location components sit at their 0 or 100 limits on 10-34% of bars, depending on the symbol and the component.
This script is for market analysis and education. It is not financial advice.
The regime is held with hysteresis and a minimum duration, so it stays stable instead of flipping on every small move, and a built-in dashboard shows the same reading for three other timeframes at once. Qyro is a context tool for your own analysis. It does not generate entry or exit signals.
KEY FEATURES
- Composite 0-100 score built from six market readings
- Five regimes: Strong Uptrend, Moderate Uptrend, Range / Low Directionality, Moderate Downtrend, Strong Downtrend
- Hysteresis and a 3-bar minimum hold for stable, readable labels
- Multi-timeframe dashboard (15m, 1H and 1D by default) calculated from completed bars
- Adaptive trend line on the price chart and score history in its own pane
- Six alerts for regime and volatility changes, with optional JSON output for webhooks
- Built-in status checks for warmup, missing volume data and timeframe settings
HOW THE SCORE IS BUILT
Each reading is converted to a 0-100 scale, where 50 is neutral. The six readings are then combined with fixed weights.
1. Path efficiency (25%)
How directly price has travelled over the last 20 bars: the net move divided by the total distance covered, signed by direction. A straight rise reads 100, a straight decline reads 0, and choppy sideways movement reads 50.
Reading: 50 + 50 × efficiency ratio × direction of the net move.
2. Adaptive trend slope (25%)
The one-bar change of a Kaufman Adaptive Moving Average (fast 2, slow 30), measured in ATR(14) units. The average speeds up when price moves efficiently and slows down in chop, so its slope reflects the quality of the trend as well as its direction.
Reading: 50 + 220 × (change in the average / ATR), limited to 0-100.
3. Price location (22%)
Where the close sits relative to the adaptive average, measured in ATR units.
Reading: 50 + 25 × ((close - average) / ATR), limited to 0-100.
4. Volatility state (13%)
ATR(14) compared with its own 56-bar average. Above 1.25 times that average the state is Expanded, below 0.85 times it is Contracted, and otherwise it is Normal.
Reading: 68 when volatility expands with price above a rising average, 32 when it expands with price below a falling average, 45 when it expands without a clear trend, 58 in normal conditions and 52 when contracted.
5. Relative volume (7%)
Current volume compared with its 20-bar average.
Reading: 40 + 20 × relative volume, limited to 0-100. Neutral (50) when the symbol has no volume data.
6. Higher-timeframe alignment (8%)
The previous completed bar of a higher timeframe (daily by default).
Reading: 75 if it closed above its own adaptive average with that average rising, 25 if it closed below with the average falling, and 50 otherwise.
HOW THE REGIME IS DETERMINED
- Uptrend begins when the score reaches 58 and ends only when it falls below 54.
- Downtrend begins when the score reaches 42 and ends only when it rises above 46.
- Strong labels apply at 75 and 25, with the same 4-point margin.
- Range / Low Directionality covers everything in between.
- Every regime must hold for at least 3 bars before it can change.
The gap between the entry and exit levels (hysteresis) keeps the label from flickering when the score hovers near a threshold. The indicator needs 69 bars of history before it displays a reading; until then, the dashboard shows how many bars remain.
WHY COMBINE THESE READINGS
Each reading answers a different question about the same move: how clean the path is (efficiency), where price is heading and where it sits (slope and location), whether the move is expanding (volatility), whether participation supports it (volume) and whether the larger timeframe agrees (higher-timeframe alignment). On its own, each answers only one of these questions. Qyro combines them into a single weighted score, stabilizes the result with hysteresis and a minimum hold, and reads every higher timeframe from completed bars only. The source code is open, so every calculation can be reviewed.
MULTI-TIMEFRAME DASHBOARD
Three configurable rows (15 minutes, 1 hour and 1 day by default) show the regime and the number of bars it has held on each timeframe, using the same formula, hysteresis and minimum hold. Each row reflects the last completed bar of its timeframe, which is what that timeframe's own chart showed one bar earlier. A row set to a timeframe at or below the chart's timeframe is marked as such.
ALERTS
Six alert conditions fire once per bar close: the regime changing to Uptrend, Downtrend or Range, and volatility changing to Expanded, Contracted or Normal. These are state changes, not trade signals.
With "Any alert() function call", the same events can be sent as plain text or, with Alert Payload Format set to JSON, as a single-line JSON object containing the event, ticker, interval, regime, score, bars held, higher-timeframe state, volatility state and bar time (UTC).
HOW TO USE IT
- Use it as market context alongside your own method, not as an entry trigger.
- Check whether the 15-minute, 1-hour and daily regimes agree before forming a directional view.
- The measurements below are for regular trading hours. On extended-session charts, expect more frequent regime changes.
- On daily charts, set Higher Timeframe to W. With the default D, that component stays neutral, and the dashboard says so.
MEASURED BEHAVIOR
Tested with default settings on MES futures, regular trading hours, 2019-2023:
- Regime changes: about 8 per session on 5-minute charts, 2.6 on 15-minute charts and 0.7 on 1-hour charts. A regime lasts a median of 5-6 bars; one in ten lasts 22-23 bars or longer.
- Stability: hysteresis and the minimum hold remove about 40% of the changes a simple threshold would produce. Widening the exit margin to 8 or 12 points reduces 5-minute changes to 6.1 or 4.5 per session.
- Responsiveness: after the 20-bar return changes direction, the matching regime appears a median of 7-8 bars later. Under the same rules, that is slower than an EMA(20) slope (6 bars) and faster than an ADX(14) filter (32 bars). Qyro changes regime less often than the EMA slope (7.8 vs 10.1 per 5-minute session) and more often than the ADX filter (3.2).
- Consistency: across 2019-2023, including the volatile years 2020 and 2022, regime changes per session varied by less than 9% between the calmest and the most volatile year on every timeframe.
- Not predictive: the regime's direction matched the direction of the next 20 bars 51-53% of the time, close to an EMA(20) slope (50.5-52%) and to ADX(14) with DI direction (50-51%). No regime label was followed by a statistically reliable return in its own direction, and in that rising market, bars labelled Downtrend were followed by average gains in almost every case.
OTHER MARKETS
Tested with default settings, without any tuning, on daily and hourly data for SPY, QQQ, AAPL, TSLA, ES, gold, crude oil, EURUSD, USDJPY, BTC and ETH:
- 9.6-11.4 regime changes per 100 bars on all 22 symbol and timeframe combinations, between an EMA(20) slope (11.5-14.2) and an ADX(14) filter (3.8-5.7).
- The matching regime appeared a median of 6-10 bars after the 20-bar return changed direction.
- Directional agreement with the next 20 bars ranged from 46% to 58%, in line with both benchmarks.
- On forex symbols without volume data, the volume component switches to neutral automatically.
SETTINGS
Every input has a tooltip. Defaults:
- Efficiency length 20; adaptive average fast 2 and slow 30; ATR 14; volatility expansion threshold 1.25
- Volume length 20; higher timeframe D
- Uptrend enter/exit 58/54; downtrend enter/exit 42/46; minimum hold 3 bars
- Dashboard rows 15, 60 and D; alert payload Text; background tint off
- Signed efficiency on (turn it off for the classic, directionless efficiency ratio)
Invalid combinations are corrected automatically and reported in the dashboard's status row: a slow length at or below the fast length is raised to fast + 1, and exit levels outside the entry levels are clamped to them.
LIMITATIONS
- Qyro describes the current market. It does not forecast it, and it is not a trading system.
- The measurements come from regular-hours MES data and public daily and hourly data. Other sessions and data feeds will behave differently.
- On 1-hour charts, the delay in confirming a new direction varies with volatility: its average rose from 12.5 bars in 2019 to 22.3 bars in 2020.
- No reading is shown for the first 69 bars.
- On Heikin Ashi, Renko and other synthetic chart types, the status row reports that the score is not meaningful.
- The slope and price-location components sit at their 0 or 100 limits on 10-34% of bars, depending on the symbol and the component.
This script is for market analysis and education. It is not financial advice.
开源脚本
秉承TradingView的精神,该脚本的作者将其开源,以便交易者可以查看和验证其功能。向作者致敬!您可以免费使用该脚本,但请记住,重新发布代码须遵守我们的网站规则。

免责声明
这些信息和出版物并非旨在提供,也不构成TradingView提供或认可的任何形式的财务、投资、交易或其他类型的建议或推荐。请阅读使用条款了解更多信息。
免责声明
这些信息和出版物并非旨在提供,也不构成TradingView提供或认可的任何形式的财务、投资、交易或其他类型的建议或推荐。请阅读使用条款了解更多信息。