OPEN-SOURCE SCRIPT
Dual Volume Profile
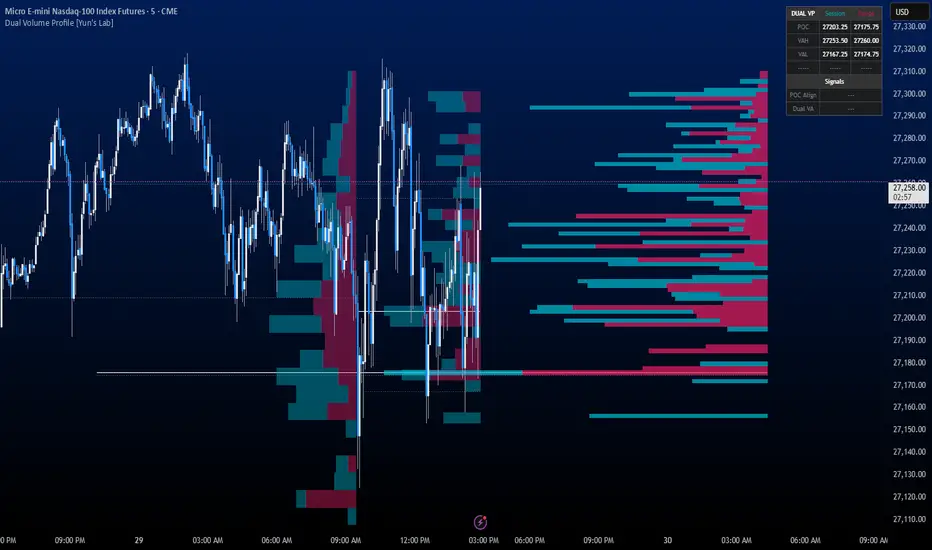
Dual Volume Profile overlays two independent volume profiles on your chart simultaneously: a session profile built from intraday trading hours, and a composite range profile built from a configurable lookback period. Comparing the two reveals whether short-term auction activity is confirming or diverging from the broader volume structure.
Inspired by TradingView's built-in VRVP and SVP HD indicators, the Dual VP combines both concepts into a single overlay — pairing the structural range view of VRVP with the per-session granularity of SVP HD — and adds a signal layer that detects when the two profiles agree or diverge.
Session profile
Builds a volume-at-price histogram for each trading session using your selected hours — CME RTH, NYSE RTH, Full Globex, or a custom window. Up to 5 historical sessions are displayed alongside the current developing session. Each session shows its own POC, VAH, and VAL.
Range profile
Builds a composite volume-at-price histogram across a configurable lookback (default 200 bars). This acts as a multi-session structural view similar to TradingView's built-in VRVP, positioned in the right margin of the chart. POC, VAH, and VAL are drawn across the full range.
Signals
The indicator generates three optional signals based on the relationship between the session and range profiles:
POC Alignment — fires when the session POC and range POC converge within a user-defined threshold, indicating agreement on fair value between the short-term and structural auctions.
Dual VA Breakout — fires when price trades above both value area highs or below both value area lows simultaneously, suggesting a directional move accepted by both timeframes.
VA Divergence — fires when the session's value area midpoint shifts significantly away from the range's value area midpoint, indicating the developing session is repricing relative to the composite structure.
How to use it
Add the indicator and select the session type matching your instrument. The session profiles draw inline over price history; the range profile anchors to the right margin. Use the info table (top-right by default) to monitor both sets of levels and active signals at a glance. Session transparency is adjustable so the histograms don't obscure candles.
Settings overview
Session Type, Sessions to Show, Session Bar Thickness, Session Transparency, Lookback Bars, Right Margin Offset, Price Rows (session and range independently), Value Area %, Up/Down volume colors, POC/VA line visibility, and signal thresholds for alignment, breakout, and divergence.
Inspired by TradingView's built-in VRVP and SVP HD indicators, the Dual VP combines both concepts into a single overlay — pairing the structural range view of VRVP with the per-session granularity of SVP HD — and adds a signal layer that detects when the two profiles agree or diverge.
Session profile
Builds a volume-at-price histogram for each trading session using your selected hours — CME RTH, NYSE RTH, Full Globex, or a custom window. Up to 5 historical sessions are displayed alongside the current developing session. Each session shows its own POC, VAH, and VAL.
Range profile
Builds a composite volume-at-price histogram across a configurable lookback (default 200 bars). This acts as a multi-session structural view similar to TradingView's built-in VRVP, positioned in the right margin of the chart. POC, VAH, and VAL are drawn across the full range.
Signals
The indicator generates three optional signals based on the relationship between the session and range profiles:
POC Alignment — fires when the session POC and range POC converge within a user-defined threshold, indicating agreement on fair value between the short-term and structural auctions.
Dual VA Breakout — fires when price trades above both value area highs or below both value area lows simultaneously, suggesting a directional move accepted by both timeframes.
VA Divergence — fires when the session's value area midpoint shifts significantly away from the range's value area midpoint, indicating the developing session is repricing relative to the composite structure.
How to use it
Add the indicator and select the session type matching your instrument. The session profiles draw inline over price history; the range profile anchors to the right margin. Use the info table (top-right by default) to monitor both sets of levels and active signals at a glance. Session transparency is adjustable so the histograms don't obscure candles.
Settings overview
Session Type, Sessions to Show, Session Bar Thickness, Session Transparency, Lookback Bars, Right Margin Offset, Price Rows (session and range independently), Value Area %, Up/Down volume colors, POC/VA line visibility, and signal thresholds for alignment, breakout, and divergence.
开源脚本
秉承TradingView的精神,该脚本的作者将其开源,以便交易者可以查看和验证其功能。向作者致敬!您可以免费使用该脚本,但请记住,重新发布代码须遵守我们的网站规则。

免责声明
这些信息和出版物并非旨在提供,也不构成TradingView提供或认可的任何形式的财务、投资、交易或其他类型的建议或推荐。请阅读使用条款了解更多信息。
免责声明
这些信息和出版物并非旨在提供,也不构成TradingView提供或认可的任何形式的财务、投资、交易或其他类型的建议或推荐。请阅读使用条款了解更多信息。