OPEN-SOURCE SCRIPT
GME Quarterly OPEX Analysis
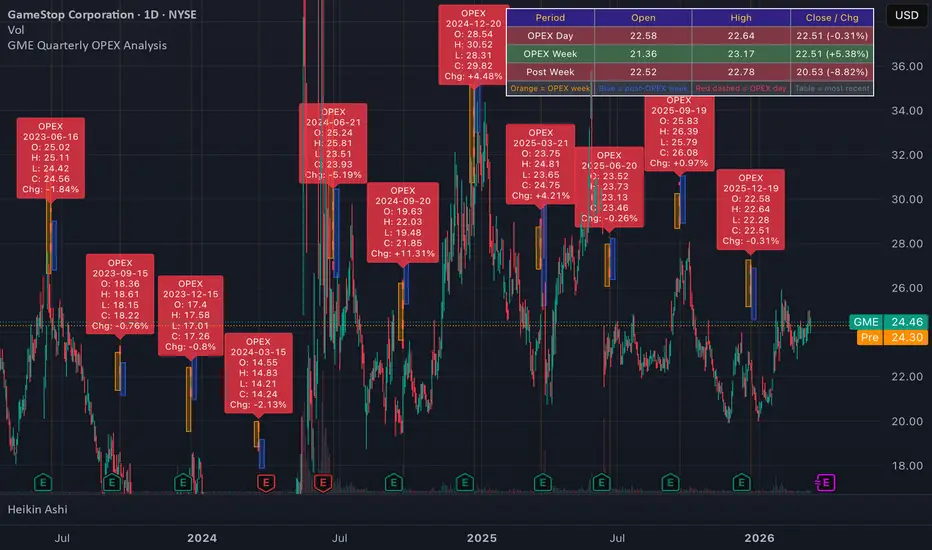
**GME Quarterly OPEX Analyzer** — marks every quarterly expiration date (3rd Friday of March, June, September, December) on a GME daily chart going back as far as chart data allows. For each OPEX it draws a red dashed vertical line, labels the day's OHLC and % change, shades the full OPEX week in orange, and shades the following week in blue. A table in the top-right shows the most recent OPEX day, OPEX week, and post-OPEX week OHLC with color-coded green/red results. Useful for visually identifying whether quarterly OPEX dates correlate with local price bottoms, tops, or reversals over time.
开源脚本
秉承TradingView的精神,该脚本的作者将其开源,以便交易者可以查看和验证其功能。向作者致敬!您可以免费使用该脚本,但请记住,重新发布代码须遵守我们的网站规则。

免责声明
这些信息和出版物并非旨在提供,也不构成TradingView提供或认可的任何形式的财务、投资、交易或其他类型的建议或推荐。请阅读使用条款了解更多信息。
免责声明
这些信息和出版物并非旨在提供,也不构成TradingView提供或认可的任何形式的财务、投资、交易或其他类型的建议或推荐。请阅读使用条款了解更多信息。