OPEN-SOURCE SCRIPT
Naked Daily Magnets (NPOC)
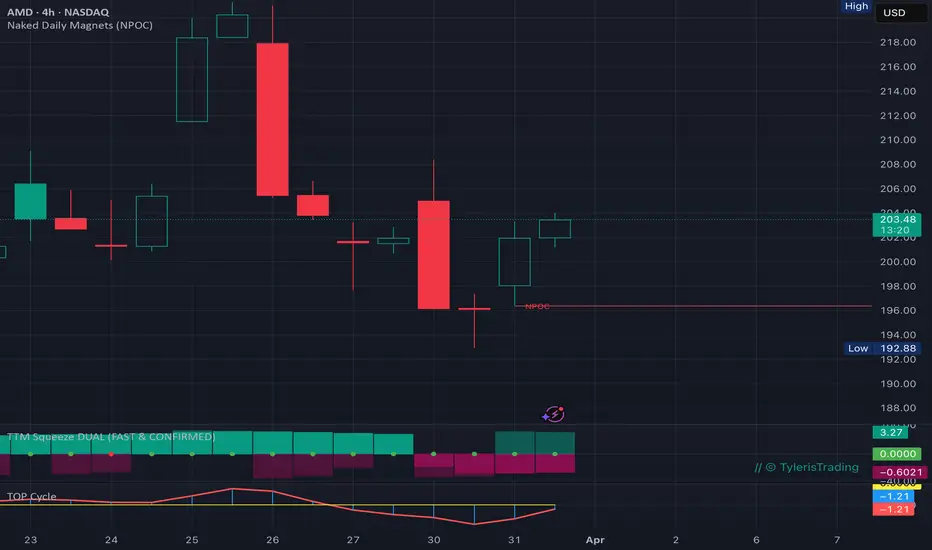
Naked Daily Magnets (NPOC)
The Strategy: Trading the Market's "Unfinished Business"
The Naked Point of Control (NPOC) looks "inside" the candles to identify exactly where the highest volume of shares changed hands during each daily session.
When the market moves aggressively away from a high-volume area and never returns to retest it, it leaves behind a "Naked" level. These levels act as massive price magnets because they represent areas of high institutional interest, unfilled limit orders, and trapped participants.
Note: This indicator is intended to be complementary to my Magnet Map indicator, which tracks institutional order flow and adjusts dynamically based on PA and volume. It can be found here:
How it Works:
Intraday Volume Scanning: The script uses lower-timeframe (1-minute) data to calculate the true Point of Control (POC) for every daily bar.
The "Naked" Logic: A horizontal magnet is projected forward into the future only if the price has NOT yet returned to that specific high-volume level.
Automatic Mitigation: As soon as a future candle "tags" or "touches" the level, the magnet is considered "cleared" and is automatically removed from your map.
Static Targets: Unlike dynamic indicators that shift with current price, these are fixed levels that provide objective targets for take-profits or high-probability entries for bounces.
How to Trade with Magnets:
Targets: If you are in a trend, look for the nearest NPOC as your primary "Exit" or "Take Profit" target. Price is statistically drawn to these high-volume "vacuums."
Support/Resistance: Naked POCs from previous days often act as the "ultimate" floor or ceiling. Expect a sharp reaction (bounce or rejection) when a line is hit for the first time in days or weeks.
The Gap Fill: Use these levels to identify where institutions are likely to defend their positions after a major gap or news event.
Key Features:
Lookback Filtering: Control how many days of historical data to scan to keep your "Map" clean and focused on recent relevant levels.
Customizable Precision: Adjust the "POC Precision" to refine how the volume bins are calculated.
Understanding "POC Precision" (Volume Bins)
Most standard indicators only look at the Open, High, Low, and Close of a day. This script is different—it "drills down" into the day and slices the price range into horizontal "bins" (like shelves). It then counts every single share traded on each shelf to find the one with the most weight.
The "Bin" Logic:
Imagine AMD traded between $200 and $210 today.
If your precision is 10, each bin is $1.00 wide ($200-201, $201-202, etc.).
If your precision is 100, each bin is only $0.10 wide.
This indicator works best on Daily (1D) or Higher Intraday (4H, 12H) timeframes to provide a high-level "Map" of the market's structural gravity.
Script by TylerisTrading
The Strategy: Trading the Market's "Unfinished Business"
The Naked Point of Control (NPOC) looks "inside" the candles to identify exactly where the highest volume of shares changed hands during each daily session.
When the market moves aggressively away from a high-volume area and never returns to retest it, it leaves behind a "Naked" level. These levels act as massive price magnets because they represent areas of high institutional interest, unfilled limit orders, and trapped participants.
Note: This indicator is intended to be complementary to my Magnet Map indicator, which tracks institutional order flow and adjusts dynamically based on PA and volume. It can be found here:
How it Works:
Intraday Volume Scanning: The script uses lower-timeframe (1-minute) data to calculate the true Point of Control (POC) for every daily bar.
The "Naked" Logic: A horizontal magnet is projected forward into the future only if the price has NOT yet returned to that specific high-volume level.
Automatic Mitigation: As soon as a future candle "tags" or "touches" the level, the magnet is considered "cleared" and is automatically removed from your map.
Static Targets: Unlike dynamic indicators that shift with current price, these are fixed levels that provide objective targets for take-profits or high-probability entries for bounces.
How to Trade with Magnets:
Targets: If you are in a trend, look for the nearest NPOC as your primary "Exit" or "Take Profit" target. Price is statistically drawn to these high-volume "vacuums."
Support/Resistance: Naked POCs from previous days often act as the "ultimate" floor or ceiling. Expect a sharp reaction (bounce or rejection) when a line is hit for the first time in days or weeks.
The Gap Fill: Use these levels to identify where institutions are likely to defend their positions after a major gap or news event.
Key Features:
Lookback Filtering: Control how many days of historical data to scan to keep your "Map" clean and focused on recent relevant levels.
Customizable Precision: Adjust the "POC Precision" to refine how the volume bins are calculated.
Understanding "POC Precision" (Volume Bins)
Most standard indicators only look at the Open, High, Low, and Close of a day. This script is different—it "drills down" into the day and slices the price range into horizontal "bins" (like shelves). It then counts every single share traded on each shelf to find the one with the most weight.
The "Bin" Logic:
Imagine AMD traded between $200 and $210 today.
If your precision is 10, each bin is $1.00 wide ($200-201, $201-202, etc.).
If your precision is 100, each bin is only $0.10 wide.
This indicator works best on Daily (1D) or Higher Intraday (4H, 12H) timeframes to provide a high-level "Map" of the market's structural gravity.
Script by TylerisTrading
开源脚本
秉承TradingView的精神,该脚本的作者将其开源,以便交易者可以查看和验证其功能。向作者致敬!您可以免费使用该脚本,但请记住,重新发布代码须遵守我们的网站规则。

// © TylerisTrading
免责声明
这些信息和出版物并非旨在提供,也不构成TradingView提供或认可的任何形式的财务、投资、交易或其他类型的建议或推荐。请阅读使用条款了解更多信息。
开源脚本
秉承TradingView的精神,该脚本的作者将其开源,以便交易者可以查看和验证其功能。向作者致敬!您可以免费使用该脚本,但请记住,重新发布代码须遵守我们的网站规则。
// © TylerisTrading
免责声明
这些信息和出版物并非旨在提供,也不构成TradingView提供或认可的任何形式的财务、投资、交易或其他类型的建议或推荐。请阅读使用条款了解更多信息。