RSI Multi-Timeframe (MTF) - Daily & Weekly Oversold Zones
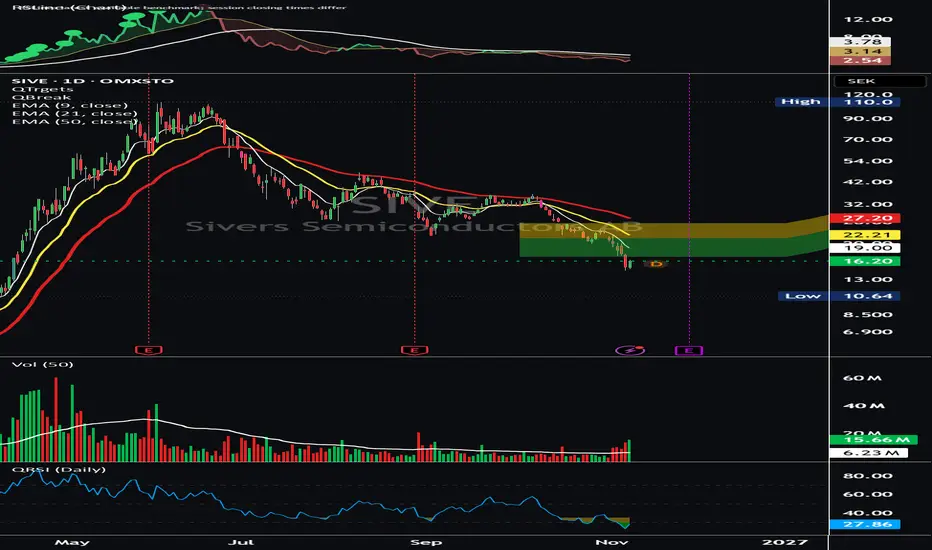
RSI Multi-Timeframe (MTF) - Daily & Weekly Oversold Zones
A clean Relative Strength Index indicator with selectable Daily or Weekly calculations and colored oversold zones.
The RSI timeframe stays independent of your price chart. You can display Weekly RSI beneath Daily candles, or keep Daily RSI while viewing an intraday chart.
How to read it
• Blue line: RSI, using the standard 14-period calculation by default.
• Green shading: the area between the RSI line and 30 when RSI falls below 30.
• Yellow shading: the area beneath 35, limited to the 30–35 band.
• Reference lines: 30, 50 and 70, plus an optional faint guide at 35.
Shading appears when RSI falls below 35. When RSI drops below 30, the area beneath 30 turns bright green and the 30–35 band remains yellow.
Settings
Daily RSI(14) is the default. The first setting provides a simple Daily / Weekly selector. RSI length, line color, line thickness and shading transparency are adjustable.
The compact QRSI chart heading shows the selected timeframe and current reading.
Timing and interpretation
The current Daily or Weekly reading can change until its source candle closes. Weekly values can appear stepped on Daily charts.
The colored zones highlight low momentum for further review. RSI can remain below 30 during continued price declines, so green shading alone does not confirm a bottom.
A clean Relative Strength Index indicator with selectable Daily or Weekly calculations and colored oversold zones.
The RSI timeframe stays independent of your price chart. You can display Weekly RSI beneath Daily candles, or keep Daily RSI while viewing an intraday chart.
How to read it
• Blue line: RSI, using the standard 14-period calculation by default.
• Green shading: the area between the RSI line and 30 when RSI falls below 30.
• Yellow shading: the area beneath 35, limited to the 30–35 band.
• Reference lines: 30, 50 and 70, plus an optional faint guide at 35.
Shading appears when RSI falls below 35. When RSI drops below 30, the area beneath 30 turns bright green and the 30–35 band remains yellow.
Settings
Daily RSI(14) is the default. The first setting provides a simple Daily / Weekly selector. RSI length, line color, line thickness and shading transparency are adjustable.
The compact QRSI chart heading shows the selected timeframe and current reading.
Timing and interpretation
The current Daily or Weekly reading can change until its source candle closes. Weekly values can appear stepped on Daily charts.
The colored zones highlight low momentum for further review. RSI can remain below 30 during continued price declines, so green shading alone does not confirm a bottom.

@StocksMathPoker on X
1amInvesting.com
1amInvesting.com
免责声明
这些信息和出版物并非旨在提供,也不构成TradingView提供或认可的任何形式的财务、投资、交易或其他类型的建议或推荐。请阅读使用条款了解更多信息。
@StocksMathPoker on X
1amInvesting.com
1amInvesting.com
免责声明
这些信息和出版物并非旨在提供,也不构成TradingView提供或认可的任何形式的财务、投资、交易或其他类型的建议或推荐。请阅读使用条款了解更多信息。