OPEN-SOURCE SCRIPT
Possible Reversal Zone Detector
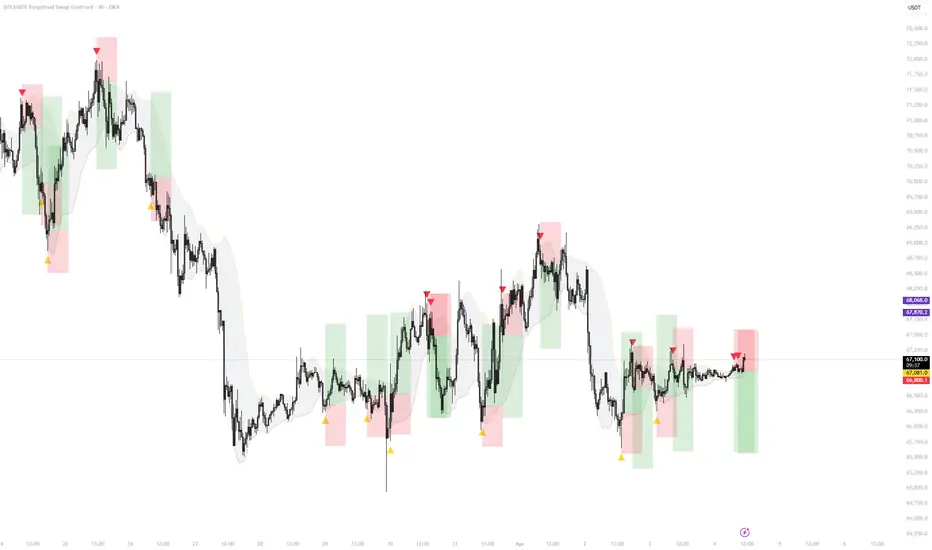
This indicator is a comprehensive tool designed to identify potential market reversal zones and mean-reversion opportunities. It utilizes a dynamic volatility channel to detect when the price becomes overextended and is likely to reverse its short-term direction.
To eliminate false signals during strong trends, it comes packed with multiple highly customizable technical filters, including RSI, Volume Spikes, and Price Action patterns. Furthermore, it visually assists traders by drawing automated Risk/Reward boxes directly on the chart upon signal generation.
Key Features & Mechanics:
Dynamic Volatility Channel: The core of the indicator relies on an EMA baseline and a Standard Deviation multiplier. It creates an envelope around the price action. Signals are generated when the price pierces these outer boundaries and shows rejection.
Volume Spike Filter (Default: ON): A reversal is much stronger when backed by heavy volume. This filter ensures that a signal is only valid if the current volume exceeds the moving average of the volume by a specified multiplier.
Automated Risk/Reward Boxes (Default: ON): Once a valid reversal signal is confirmed, the indicator instantly plots a customizable Risk/Reward box (Default 1:2 RR, 1% Stop Loss) on your chart. This allows you to visually plan your trade, target, and invalidation level effortlessly.
RSI Filter (Default: OFF): When enabled, it checks if the asset is mathematically overbought or oversold before confirming a reversal from the channel boundaries.
Price Action Filters (Default: OFF): For the ultimate "sniper" entry, you can require the indicator to look for specific candlestick patterns—such as a Pinbar (Wick Rejection) or an Engulfing pattern—at the exact moment the price tests the channel boundary.
How to Use:
Wait for the visual arrows (Yellow for Bullish, Red for Bearish) to appear. These indicate that the price has breached the volatility band and satisfied your selected filters (like volume spikes). Evaluate the automatically drawn Risk/Reward box to see if the setup matches your risk management strategy.
Customization:
Every aspect of this indicator is adjustable. You can tweak the channel sensitivity, volume requirements, RSI levels, and the exact dimensions of the Risk/Reward boxes to fit any timeframe or asset class.
Disclaimer: This script is for educational purposes only and does not constitute financial advice. Always use proper risk management.
To eliminate false signals during strong trends, it comes packed with multiple highly customizable technical filters, including RSI, Volume Spikes, and Price Action patterns. Furthermore, it visually assists traders by drawing automated Risk/Reward boxes directly on the chart upon signal generation.
Key Features & Mechanics:
Dynamic Volatility Channel: The core of the indicator relies on an EMA baseline and a Standard Deviation multiplier. It creates an envelope around the price action. Signals are generated when the price pierces these outer boundaries and shows rejection.
Volume Spike Filter (Default: ON): A reversal is much stronger when backed by heavy volume. This filter ensures that a signal is only valid if the current volume exceeds the moving average of the volume by a specified multiplier.
Automated Risk/Reward Boxes (Default: ON): Once a valid reversal signal is confirmed, the indicator instantly plots a customizable Risk/Reward box (Default 1:2 RR, 1% Stop Loss) on your chart. This allows you to visually plan your trade, target, and invalidation level effortlessly.
RSI Filter (Default: OFF): When enabled, it checks if the asset is mathematically overbought or oversold before confirming a reversal from the channel boundaries.
Price Action Filters (Default: OFF): For the ultimate "sniper" entry, you can require the indicator to look for specific candlestick patterns—such as a Pinbar (Wick Rejection) or an Engulfing pattern—at the exact moment the price tests the channel boundary.
How to Use:
Wait for the visual arrows (Yellow for Bullish, Red for Bearish) to appear. These indicate that the price has breached the volatility band and satisfied your selected filters (like volume spikes). Evaluate the automatically drawn Risk/Reward box to see if the setup matches your risk management strategy.
Customization:
Every aspect of this indicator is adjustable. You can tweak the channel sensitivity, volume requirements, RSI levels, and the exact dimensions of the Risk/Reward boxes to fit any timeframe or asset class.
Disclaimer: This script is for educational purposes only and does not constitute financial advice. Always use proper risk management.
开源脚本
秉承TradingView的精神,该脚本的作者将其开源,以便交易者可以查看和验证其功能。向作者致敬!您可以免费使用该脚本,但请记住,重新发布代码须遵守我们的网站规则。

免责声明
这些信息和出版物并非旨在提供,也不构成TradingView提供或认可的任何形式的财务、投资、交易或其他类型的建议或推荐。请阅读使用条款了解更多信息。
开源脚本
秉承TradingView的精神,该脚本的作者将其开源,以便交易者可以查看和验证其功能。向作者致敬!您可以免费使用该脚本,但请记住,重新发布代码须遵守我们的网站规则。
免责声明
这些信息和出版物并非旨在提供,也不构成TradingView提供或认可的任何形式的财务、投资、交易或其他类型的建议或推荐。请阅读使用条款了解更多信息。