Return Distribution Profile [QuantAlgo]
More exclusive indicators from QuantAlgo
Subscribe to QuantAlgo Essential for $49.99/month to get exclusive indicators by this author. You pay right on TradingView and can use them on your charts straight away.
Explore QuantAlgo Essential🟢 Overview
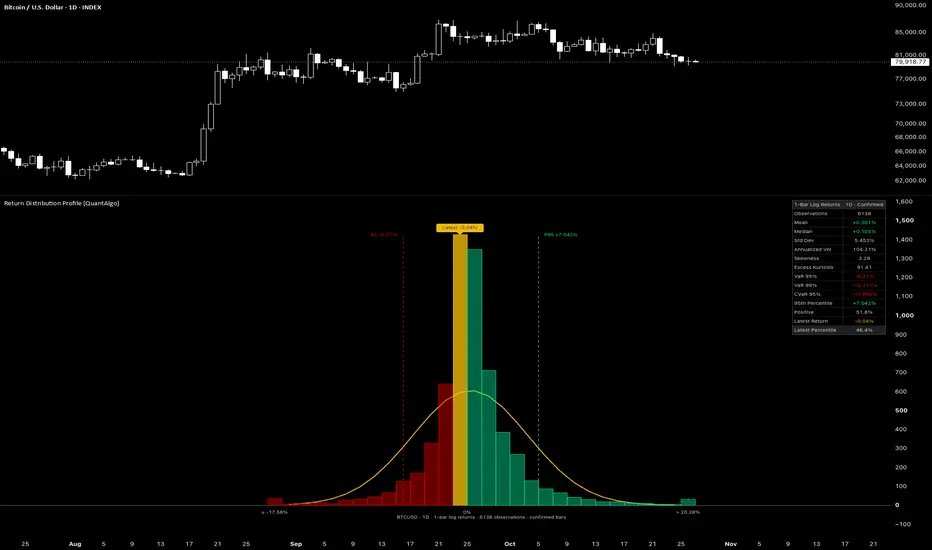
The Return Distribution Profile is a statistical tool that draws the full distribution of a market’s returns as a histogram beside the latest bars, showing how often each size of move has occurred. It compares that shape with a normal distribution of the same mean and standard deviation, marks where the latest return falls, and reads out the figures behind it, from volatility and skewness to value at risk and expected shortfall. Whether you size positions, set stops, or want to know whether the latest move is ordinary or rare, the indicator puts the shape of a market’s risk directly on the chart.

🟢 What is a Return Distribution?
A return distribution counts how often price has moved by each amount over a set span, such as one bar, and sorts those moves from the largest losses to the largest gains. Many models assume returns follow a normal distribution, the familiar bell curve that is fully described by its mean and standard deviation. In most markets the real shape differs: returns crowd more tightly around zero, large moves occur more often than a normal distribution implies, and losses and gains often stretch unevenly to each side. These departures matter because risk estimates built on the bell curve alone can understate how far extreme moves reach. Reading the actual distribution shows how wide a typical move is, how deep the worst moves go, and where any single return ranks against the history behind it.

🟢 Key Features
▶ Return Distribution Histogram
Each return is measured from the close a set number of bars back, set by Return Horizon, so the histogram can show bar-to-bar moves or multi-bar swings, such as weekly moves on a daily chart. Return Type chooses how each move is expressed:
1. Log takes the natural logarithm of the price ratio, so returns add up across bars and a gain and a loss of the same size in log terms cancel out.
2. Simple takes the percentage change in price, so every figure reads directly as the actual price move.

The most recent returns, up to the Sample Size, are sorted into bins whose edges are aligned to 0%, so every column holds either returns at or below zero or returns above it, never both. Each column takes the negative or positive return color to match, and the share of returns in the columns above zero matches the Positive figure in the dashboard. Column Height shows each bin as a count of returns or as a percent of the sample, which keeps histograms from different symbols and timeframes comparable.
The histogram sits in its own pane with its right edge on the latest bar, so it is in view as soon as the indicator loads, and Histogram Offset moves it further back or forward into the space ahead of price. Range labels mark the ends of the histogram and the 0% boundary, and a caption names the symbol, timeframe, return horizon and type, number of observations, and bar data in use.
▶ Histogram Range
A few extreme returns can stretch a histogram so far that most returns crowd into a handful of columns. Histogram Range sets how far the bins span:
1. Full Range runs from the lowest to the highest return in the sample.
2. Percentile spans the returns between a set trim at each end, such as the 0.5th to the 99.5th percentile.
3. Std Dev spans the mean plus and minus a set number of standard deviations.
Under the trimmed options, the end columns collect every return beyond the span and are drawn with a dashed outline, and their labels read the edge each one collects from. Hovering over those labels shows how many returns each end column holds and the most extreme of them, so no return is left out. The range changes the display only, while every statistic and alert still uses the full sample.

▶ Normal Curve and Tail Markers
A line traces the count each column would hold if returns followed a normal distribution with the same mean and standard deviation as the sample. Each point comes from the share of that distribution falling between the column’s edges, so the line and the columns compare like for like at any bin width. Columns rising above the line at the center and in the far tails, with shortfalls in between, reveal fat tails, while a longer run of columns on one side of the center reveals skew.
Dashed tail markers sit at the lower and upper tail levels set by Tail Level, such as the 5th and 95th percentiles, each labeled with its percentile and return. The columns beyond each marker hold the returns the tail alerts respond to.

▶ Latest Return Highlight
The column holding the latest return is filled in the Highlight Color, and a label above it reads the latest return, so the current move can be placed within the full distribution at a glance. Hovering over the label shows where that return ranks within the sample. Bar Data decides which return counts as the latest:
1. Confirmed uses closed bars only, so the histogram and every figure hold steady while a bar forms and update once it closes.
2. Live also counts the forming bar, adding its return to the sample as price develops, so the highlight, the label, and the dashboard update with each price change.

▶ Statistics Dashboard
The dashboard lists the statistics of the sample in a single table that can be placed in any of nine positions, with a Compact layout that keeps the core rows for smaller screens.
1. Observations: The number of returns in the sample.
2. Mean: The average return.
3. Median: The middle return, with half of the sample below it.
4. Std Dev: The typical spread of returns around the mean.
5. Annualized Vol: Std Dev scaled to a yearly figure.
6. Skewness: How lopsided the distribution is, negative when large losses stretch further than large gains.
7. Excess Kurtosis: How heavy the tails are compared with a normal distribution.
8. VaR 95%: The return that 5% of the sample fell below.
9. VaR 99%: The return that 1% of the sample fell below.
10. CVaR 95%: The average of the returns at or below VaR 95%, showing how deep the worst 5% of returns go.
11. 95th Percentile: The upside counterpart of VaR 95%.
12. Positive: The share of returns above 0%.
13. Latest Return: The return of the latest bar.
14. Latest Percentile: Where the latest return ranks within the sample.

Annualized Vol works out the number of bars in a year from the chart itself, using 365.25 trading days for markets that trade every day of the week and 252 for markets with weekly closures, and measuring the bars in a trading day on intraday charts of markets with sessions. A custom bars-per-year figure covers any specific convention.
▶ Configurable Statistics
Several measurements have more than one accepted convention, and each can be set to match the reference it is compared against.
1. Statistics Basis: Population divides by the number of observations, the same basis as TradingView’s built-in standard deviation, while Sample Adjusted applies the small-sample corrections used by spreadsheet functions and most statistical software.
2. Kurtosis Type: Excess reads zero for a normal shape, while Raw reads 3.
3. Percentile Method: Linear Interpolation blends neighboring returns into smooth values, while Nearest Rank always reports an actual past return.
4. VaR Display: Return shows losses as negative returns, while Loss shows them as positive amounts at risk, the convention common in risk reporting.
5. Positive Share: All Returns counts unchanged closes against the share, while Non-Zero Returns leaves them out, the way a win rate that ignores flat outcomes is read.
6. Latest Percentile Rank: At or Below, Below, or Midpoint sets how returns equal to the latest one are counted.

▶ Built-in Alerts
Three ready-made alert conditions fire when a return lands in the tails of the distribution. Each return is judged against the sample as it stood before its bar, at the close under Confirmed bar data or as the forming bar develops under Live.
1. Lower Tail Return: Fires when a return falls below the lower tail level.
2. Upper Tail Return: Fires when a return rises above the upper tail level.
3. Any Tail Return: Fires when a return lands beyond either tail level.
The Any alert() function call option also delivers a detailed message with the symbol, the return, and the tail level it crossed.

▶ Visual Customization
Six color presets (Classic, Aqua, Cosmic, Cyber, Neon, Custom) set the positive and negative return colors across the histogram, the tail markers, and the dashboard, and Custom mode exposes individual color pickers. The normal curve, the latest return highlight, and its label keep their own Highlight Color under every preset. On light chart backgrounds, colors too bright to stand out are darkened automatically, and on dark backgrounds colors too dark to stand out are lightened, so every preset stays readable on either theme. Column opacity, curve width, bin count and width, decimal places from Auto to 8, and text size from Tiny to Large are all adjustable, and the curve, tail markers, highlight, labels, caption, and dashboard can each be shown or hidden on their own.

The Return Distribution Profile is a statistical tool that draws the full distribution of a market’s returns as a histogram beside the latest bars, showing how often each size of move has occurred. It compares that shape with a normal distribution of the same mean and standard deviation, marks where the latest return falls, and reads out the figures behind it, from volatility and skewness to value at risk and expected shortfall. Whether you size positions, set stops, or want to know whether the latest move is ordinary or rare, the indicator puts the shape of a market’s risk directly on the chart.
🟢 What is a Return Distribution?
A return distribution counts how often price has moved by each amount over a set span, such as one bar, and sorts those moves from the largest losses to the largest gains. Many models assume returns follow a normal distribution, the familiar bell curve that is fully described by its mean and standard deviation. In most markets the real shape differs: returns crowd more tightly around zero, large moves occur more often than a normal distribution implies, and losses and gains often stretch unevenly to each side. These departures matter because risk estimates built on the bell curve alone can understate how far extreme moves reach. Reading the actual distribution shows how wide a typical move is, how deep the worst moves go, and where any single return ranks against the history behind it.
🟢 Key Features
▶ Return Distribution Histogram
Each return is measured from the close a set number of bars back, set by Return Horizon, so the histogram can show bar-to-bar moves or multi-bar swings, such as weekly moves on a daily chart. Return Type chooses how each move is expressed:
1. Log takes the natural logarithm of the price ratio, so returns add up across bars and a gain and a loss of the same size in log terms cancel out.
2. Simple takes the percentage change in price, so every figure reads directly as the actual price move.
The most recent returns, up to the Sample Size, are sorted into bins whose edges are aligned to 0%, so every column holds either returns at or below zero or returns above it, never both. Each column takes the negative or positive return color to match, and the share of returns in the columns above zero matches the Positive figure in the dashboard. Column Height shows each bin as a count of returns or as a percent of the sample, which keeps histograms from different symbols and timeframes comparable.
The histogram sits in its own pane with its right edge on the latest bar, so it is in view as soon as the indicator loads, and Histogram Offset moves it further back or forward into the space ahead of price. Range labels mark the ends of the histogram and the 0% boundary, and a caption names the symbol, timeframe, return horizon and type, number of observations, and bar data in use.
▶ Histogram Range
A few extreme returns can stretch a histogram so far that most returns crowd into a handful of columns. Histogram Range sets how far the bins span:
1. Full Range runs from the lowest to the highest return in the sample.
2. Percentile spans the returns between a set trim at each end, such as the 0.5th to the 99.5th percentile.
3. Std Dev spans the mean plus and minus a set number of standard deviations.
Under the trimmed options, the end columns collect every return beyond the span and are drawn with a dashed outline, and their labels read the edge each one collects from. Hovering over those labels shows how many returns each end column holds and the most extreme of them, so no return is left out. The range changes the display only, while every statistic and alert still uses the full sample.
▶ Normal Curve and Tail Markers
A line traces the count each column would hold if returns followed a normal distribution with the same mean and standard deviation as the sample. Each point comes from the share of that distribution falling between the column’s edges, so the line and the columns compare like for like at any bin width. Columns rising above the line at the center and in the far tails, with shortfalls in between, reveal fat tails, while a longer run of columns on one side of the center reveals skew.
Dashed tail markers sit at the lower and upper tail levels set by Tail Level, such as the 5th and 95th percentiles, each labeled with its percentile and return. The columns beyond each marker hold the returns the tail alerts respond to.
▶ Latest Return Highlight
The column holding the latest return is filled in the Highlight Color, and a label above it reads the latest return, so the current move can be placed within the full distribution at a glance. Hovering over the label shows where that return ranks within the sample. Bar Data decides which return counts as the latest:
1. Confirmed uses closed bars only, so the histogram and every figure hold steady while a bar forms and update once it closes.
2. Live also counts the forming bar, adding its return to the sample as price develops, so the highlight, the label, and the dashboard update with each price change.
▶ Statistics Dashboard
The dashboard lists the statistics of the sample in a single table that can be placed in any of nine positions, with a Compact layout that keeps the core rows for smaller screens.
1. Observations: The number of returns in the sample.
2. Mean: The average return.
3. Median: The middle return, with half of the sample below it.
4. Std Dev: The typical spread of returns around the mean.
5. Annualized Vol: Std Dev scaled to a yearly figure.
6. Skewness: How lopsided the distribution is, negative when large losses stretch further than large gains.
7. Excess Kurtosis: How heavy the tails are compared with a normal distribution.
8. VaR 95%: The return that 5% of the sample fell below.
9. VaR 99%: The return that 1% of the sample fell below.
10. CVaR 95%: The average of the returns at or below VaR 95%, showing how deep the worst 5% of returns go.
11. 95th Percentile: The upside counterpart of VaR 95%.
12. Positive: The share of returns above 0%.
13. Latest Return: The return of the latest bar.
14. Latest Percentile: Where the latest return ranks within the sample.
Annualized Vol works out the number of bars in a year from the chart itself, using 365.25 trading days for markets that trade every day of the week and 252 for markets with weekly closures, and measuring the bars in a trading day on intraday charts of markets with sessions. A custom bars-per-year figure covers any specific convention.
▶ Configurable Statistics
Several measurements have more than one accepted convention, and each can be set to match the reference it is compared against.
1. Statistics Basis: Population divides by the number of observations, the same basis as TradingView’s built-in standard deviation, while Sample Adjusted applies the small-sample corrections used by spreadsheet functions and most statistical software.
2. Kurtosis Type: Excess reads zero for a normal shape, while Raw reads 3.
3. Percentile Method: Linear Interpolation blends neighboring returns into smooth values, while Nearest Rank always reports an actual past return.
4. VaR Display: Return shows losses as negative returns, while Loss shows them as positive amounts at risk, the convention common in risk reporting.
5. Positive Share: All Returns counts unchanged closes against the share, while Non-Zero Returns leaves them out, the way a win rate that ignores flat outcomes is read.
6. Latest Percentile Rank: At or Below, Below, or Midpoint sets how returns equal to the latest one are counted.
▶ Built-in Alerts
Three ready-made alert conditions fire when a return lands in the tails of the distribution. Each return is judged against the sample as it stood before its bar, at the close under Confirmed bar data or as the forming bar develops under Live.
1. Lower Tail Return: Fires when a return falls below the lower tail level.
2. Upper Tail Return: Fires when a return rises above the upper tail level.
3. Any Tail Return: Fires when a return lands beyond either tail level.
The Any alert() function call option also delivers a detailed message with the symbol, the return, and the tail level it crossed.
▶ Visual Customization
Six color presets (Classic, Aqua, Cosmic, Cyber, Neon, Custom) set the positive and negative return colors across the histogram, the tail markers, and the dashboard, and Custom mode exposes individual color pickers. The normal curve, the latest return highlight, and its label keep their own Highlight Color under every preset. On light chart backgrounds, colors too bright to stand out are darkened automatically, and on dark backgrounds colors too dark to stand out are lightened, so every preset stays readable on either theme. Column opacity, curve width, bin count and width, decimal places from Auto to 8, and text size from Tiny to Large are all adjustable, and the curve, tail markers, highlight, labels, caption, and dashboard can each be shown or hidden on their own.

🟢 Access our best trading & investing tools: joinquantalgo.com/plans
🟢 Free Special Edition indicators: joinquantalgo.com/special-editions
🟢 Discord: discord.gg/hJaFyGEAyX
🟢 Free Special Edition indicators: joinquantalgo.com/special-editions
🟢 Discord: discord.gg/hJaFyGEAyX
免责声明
这些信息和出版物并非旨在提供,也不构成TradingView提供或认可的任何形式的财务、投资、交易或其他类型的建议或推荐。请阅读使用条款了解更多信息。
🟢 Access our best trading & investing tools: joinquantalgo.com/plans
🟢 Free Special Edition indicators: joinquantalgo.com/special-editions
🟢 Discord: discord.gg/hJaFyGEAyX
🟢 Free Special Edition indicators: joinquantalgo.com/special-editions
🟢 Discord: discord.gg/hJaFyGEAyX
免责声明
这些信息和出版物并非旨在提供,也不构成TradingView提供或认可的任何形式的财务、投资、交易或其他类型的建议或推荐。请阅读使用条款了解更多信息。