OPEN-SOURCE SCRIPT
AI Smart Order Flow Volume Candles
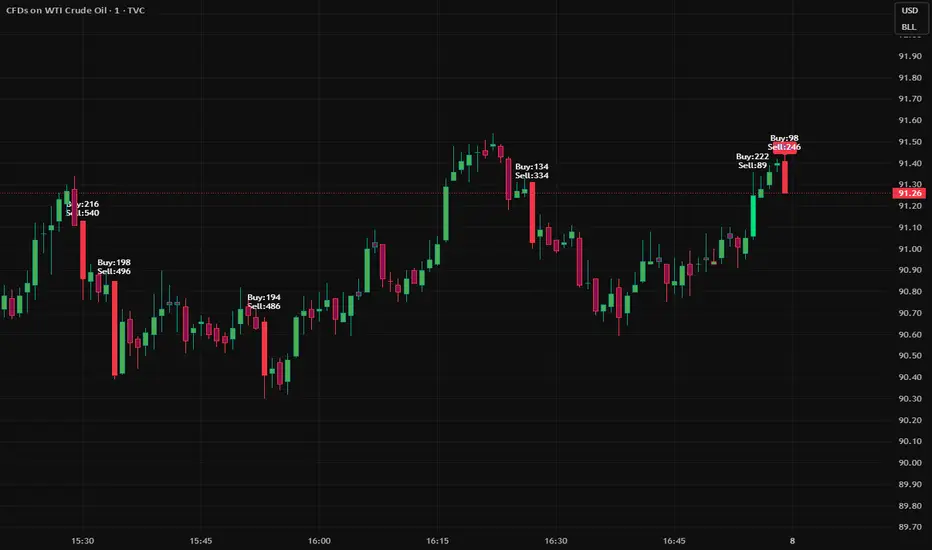
AI Smart Order Flow Volume Candles
The Smart Order Flow Volume Candles indicator is designed to help traders identify institutional buying and selling pressure using a combination of volume analysis, liquidity sweeps, and order flow delta.
This indicator highlights potential high-probability trade setups by analyzing how volume behaves during key market movements.
Key Features
1. Volume Delta Analysis
The script estimates buy and sell volume based on candle direction and calculates the volume delta (buy volume – sell volume).
Positive delta indicates strong buying pressure
Negative delta indicates strong selling pressure
2. Volume Spike Detection
The indicator detects unusual volume spikes by comparing current volume to the 20-period volume moving averagemultiplied by a configurable multiplier.
These spikes often signal institutional participation.
3. Liquidity Sweep Identification
The script identifies potential liquidity grabs, a common strategy used by large traders:
Buy setup: Price sweeps recent lows and closes bullish.
Sell setup: Price sweeps recent highs and closes bearish.
4. Smart Trade Signals
A trade signal is generated when three conditions align:
Liquidity sweep occurs
Volume spike is detected
Volume delta confirms buying or selling pressure
This combination helps filter out low-quality trades.
5. Automatic Risk Management
The indicator automatically calculates:
Stop Loss (SL) using ATR (Average True Range)
Take Profit (TP) using a configurable Risk-Reward ratio
It visually displays the trade setup using a risk-reward box on the chart.
6. Volume-Based Candle Coloring
Candles are colored to visually represent market pressure:
Bright Lime: Strong bullish volume spike
Red: Strong bearish volume spike
Green: Normal bullish candle
Maroon: Normal bearish candle
7. Buy / Sell Volume Display
During volume spikes, the indicator displays estimated buy vs sell volume numbers directly on the chart for quick order-flow insight.
Benefits
Helps identify institutional activity
Detects liquidity traps
Provides clear trade entries
Includes visual risk-reward management
Enhances volume-based price action analysis
Best Used For
Scalping
Day trading
Intraday crypto / forex / index trading
Works best on lower timeframes (1m – 15m) where liquidity sweeps and volume spikes occur frequently.
The Smart Order Flow Volume Candles indicator is designed to help traders identify institutional buying and selling pressure using a combination of volume analysis, liquidity sweeps, and order flow delta.
This indicator highlights potential high-probability trade setups by analyzing how volume behaves during key market movements.
Key Features
1. Volume Delta Analysis
The script estimates buy and sell volume based on candle direction and calculates the volume delta (buy volume – sell volume).
Positive delta indicates strong buying pressure
Negative delta indicates strong selling pressure
2. Volume Spike Detection
The indicator detects unusual volume spikes by comparing current volume to the 20-period volume moving averagemultiplied by a configurable multiplier.
These spikes often signal institutional participation.
3. Liquidity Sweep Identification
The script identifies potential liquidity grabs, a common strategy used by large traders:
Buy setup: Price sweeps recent lows and closes bullish.
Sell setup: Price sweeps recent highs and closes bearish.
4. Smart Trade Signals
A trade signal is generated when three conditions align:
Liquidity sweep occurs
Volume spike is detected
Volume delta confirms buying or selling pressure
This combination helps filter out low-quality trades.
5. Automatic Risk Management
The indicator automatically calculates:
Stop Loss (SL) using ATR (Average True Range)
Take Profit (TP) using a configurable Risk-Reward ratio
It visually displays the trade setup using a risk-reward box on the chart.
6. Volume-Based Candle Coloring
Candles are colored to visually represent market pressure:
Bright Lime: Strong bullish volume spike
Red: Strong bearish volume spike
Green: Normal bullish candle
Maroon: Normal bearish candle
7. Buy / Sell Volume Display
During volume spikes, the indicator displays estimated buy vs sell volume numbers directly on the chart for quick order-flow insight.
Benefits
Helps identify institutional activity
Detects liquidity traps
Provides clear trade entries
Includes visual risk-reward management
Enhances volume-based price action analysis
Best Used For
Scalping
Day trading
Intraday crypto / forex / index trading
Works best on lower timeframes (1m – 15m) where liquidity sweeps and volume spikes occur frequently.
开源脚本
秉承TradingView的精神,该脚本的作者将其开源,以便交易者可以查看和验证其功能。向作者致敬!您可以免费使用该脚本,但请记住,重新发布代码须遵守我们的网站规则。

免责声明
这些信息和出版物并非旨在提供,也不构成TradingView提供或认可的任何形式的财务、投资、交易或其他类型的建议或推荐。请阅读使用条款了解更多信息。
免责声明
这些信息和出版物并非旨在提供,也不构成TradingView提供或认可的任何形式的财务、投资、交易或其他类型的建议或推荐。请阅读使用条款了解更多信息。