HTF "The Strat" with statistics
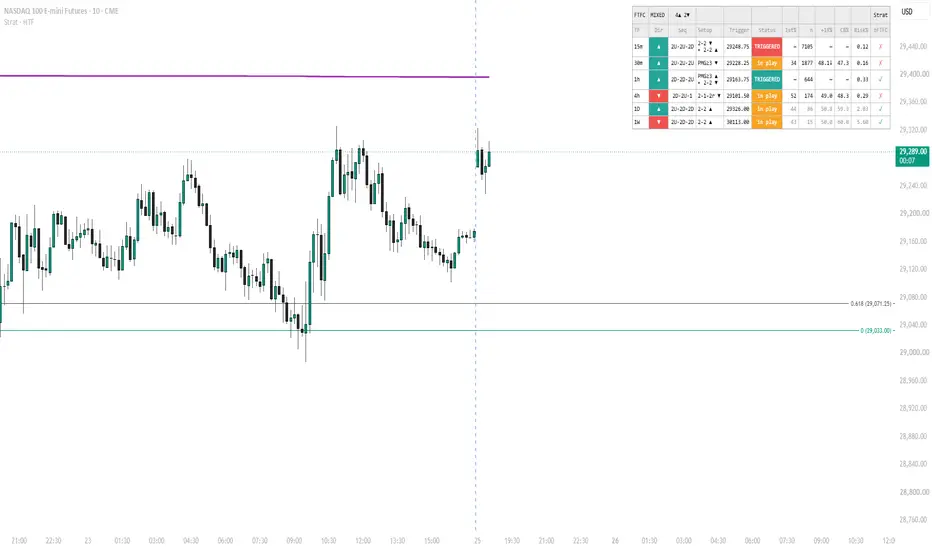
STRAT · HTF — SUMMARY AND USER GUIDE
Strat · HTF shows the Strat state of six higher timeframes (15m, 30m, 1h, 4h, 1D, 1W) in one dashboard, draws a chosen timeframe as floating candles with entry and stop levels, and attaches historical NQ statistics to every live setup. It describes what the chart is doing. It does not tell you to buy or sell.
1. WHAT THE INDICATOR DOES
The Strat in one paragraph. Every bar is classified by how its high and low compare with the previous bar's. Equal highs or lows are not breaks.
- 1 = Inside: neither the previous high nor low was broken
- 2U = Two up: only the previous high was broken
- 2D = Two down: only the previous low was broken
- 3 = Outside: both the previous high and low were broken
Setups it detects. A setup is a short sequence of bars. The last closed bar is the "setup bar". The next bar is the "trigger bar": whichever side of the setup bar it breaks first is the trade.
- 3-1-2: outside bar, then inside bar. Side is set by the inside bar's colour (up or flat = long, down = short).
- 2-1-2c / 2-1-2r: a 2U or 2D, then an inside bar. Same side rule. "c" breaks in the direction of the first 2 (continuation), "r" against it (reversal).
- 2-2: a 2U or 2D, then the opposite 2. Reversal of the last closed bar.
- 3-2-2: outside bar, then a 2U or 2D. Reversal of the last closed bar.
- 1-2-2: inside bar, then a 2U or 2D. Reversal of the last closed bar (the "rev strat").
- PMG: a run of N same-direction 2 bars (N = 2 to 4). Reversal of the run.
Two states. A row is "in play" when the setup bar has closed and the trigger bar has not happened yet. It becomes "TRIGGERED" when the last closed bar is a single-sided trigger bar (2U or 2D) that completed one of the patterns above. The in-play setup that the same closed bar creates is shown beside it, on a second line starting with ▸.
What you get on the chart:
- A dashboard with one row per timeframe and a full-timeframe-continuity (FTFC) banner.
- Optional floating HTF candles to the right of price, with Strat numbers and setup labels.
- Dotted dividers on the real price chart at each HTF boundary.
- Entry and stop lines for the setup on the overlay timeframe.
- Five statistics columns (1st%, n, +1R%, CB%, Risk%) with a hover tooltip, measured on NQ.
- Two alerts: a new setup triggering on any timeframe, and full timeframe continuity.
Everything is calculated from closed higher-timeframe bars, so setups do not repaint. The one exception is the optional "Live FTFC" setting (section 2).
2. CONFIGURING THE INDICATOR
The defaults work on an NQ chart at 15 minutes or lower. Open the settings with the gear icon on the indicator's name. The inputs sit in four groups.
Quick start. Use a chart timeframe at or below 15m so all six rows are live (rows for timeframes shorter than the chart show "—"). Set "Overlay TF" to the timeframe you are watching. Leave the stats columns on, and hover cells for detail.
SETUPS
- PMG run length (default 3, range 2 to 4): how many consecutive same-direction 2 bars make a PMG.
- 2-2 reversal, 2-1-2, 3-1-2, 1-2-2, 3-2-2, PMG (all on by default): switch each setup on or off.
Setups are checked in this order: PMG, 3-1-2, 2-1-2, 3-2-2, 1-2-2, 2-2. If you switch a setup off, its bars can fall through to a later name (for example, with 3-2-2 off the same bars are labelled 2-2). The statistics always follow the actual bar pattern, and the tooltip names the exact study cell.
DASHBOARD
- Show dashboard (on): shows or hides the table.
- Live FTFC (off): off = the Dir column uses the last closed candle's colour (stable). On = it uses current price against each timeframe's open, the classic FTFC, and repaints while the bar forms.
- Continuity column (on): adds a ± column. ✓ if the row's setup points with the overall continuity, ✗ if against.
- Historical stats columns (on): adds 1st%, n, +1R%, CB%, Risk% (section 4).
- Show stats on non-NQ symbols (off): the numbers were measured on NQ only. Tick this only if you accept applying them elsewhere.
- Position (Top, Right): where the table sits.
- Text size, Monospace font (Small, on): table typography.
- Colours: text, muted text, cell and header backgrounds, up and down (teal and red), in play (amber), text on colour, border and frame.
The stats columns only appear when the symbol is NQ or MNQ, unless you tick the override.
HTF OVERLAY
- Overlay TF (None): None, 15m, 30m, 1h, 4h, 1D or 1W. Must be equal to or higher than the chart timeframe. It also sets the timeframe used for entry and stop lines.
- Candles to draw (10, range 2 to 40): number of floating HTF candles.
- Offset from price (8 bars): gap between the last real bar and the cluster.
- Candle spacing (4, range 3 to 12): horizontal room per candle.
- Auto-fit height (on): scales the cluster to a readable height.
- Auto-fit target in ATRs (25): target cluster height as a multiple of the chart's ATR(14).
- Manual height scale (0.5): used when auto-fit is off (1 = true price height).
- Strat number labels (on): shows 1, 2U, 2D or 3 above each candle.
- Setup labels (on): shows the completed pattern name below the trigger candle.
- Colours: body, border, wick, number text, setup text.
- TF dividers on price chart (on): dotted vertical lines at each overlay-timeframe boundary, at true price.
- Divider colour, style, width, count (grey, dotted, 1, 20): the number of dividers to keep ranges from 2 to 60.
LEVELS
- Draw entry / stop levels (on): draws levels for the overlay timeframe's current setup. Needs an Overlay TF other than None.
- Long trig / short stop colour (teal) and Short trig / long stop colour (red).
- Line width (1).
- Extend in bars (30, range 5 to 200): how far the lines run to the right.
ALERTS
Choose "Create alert", then pick Strat · HTF as the condition. Two alerts are available:
- Any HTF setup triggered: fires once for each new trigger on any of the six timeframes, not on every chart bar while the state lasts.
- Full timeframe continuity: fires while all valid timeframes are aligned.
3. LINES AND LEVELS ON THE CHART
Three things are drawn on the chart: the floating HTF candles, dotted dividers at true price, and entry and stop lines. All three follow the "Overlay TF" setting, so set it to the timeframe you are watching.
- Floating HTF candles: the overlay timeframe's last N candles, rebuilt from chart bars. They sit to the right of the last bar, newest at the right edge. Use them to see the Strat sequence at a glance.
- Strat numbers: 1, 2U, 2D or 3 above each candle. They save you counting highs and lows.
- Setup labels: the pattern name and ▲ or ▼ below the candle that completed the pattern. They show where past patterns triggered.
- TF dividers: dotted vertical lines at each overlay-timeframe boundary, on the real price chart at true price. They show where each HTF candle begins and ends.
- Entry line: a solid line in the trade's colour (teal long, red short) at the trigger level, plus or minus 1 tick. It shows where the trade triggers.
- Stop line: a grey dashed line at the far side of the setup bar, plus or minus 1 tick. It shows where the setup fails and how big 1R is.
Floating HTF candles
The cluster is compressed vertically to a readable height, so do not read prices from it. Use the dividers and the entry and stop lines, which sit at true price. The newest candle is still forming: its number and any setup label can change until the bar closes. Older candles are final.
Entry and stop lines
The lines are drawn for the overlay timeframe's current setup, in play or TRIGGERED. They start at the beginning of the last closed overlay-timeframe candle and run 30 bars to the right (adjustable). Two labels sit at their right end, for example "1h ▲ long 21345.25 2-2" on the entry line and "stop 21300.00" on the stop line.
They follow the same definitions as the study (section 5):
- Entry = the setup bar's high plus 1 tick for a long, or its low minus 1 tick for a short.
- Stop = the setup bar's opposite extreme, minus 1 tick for a long or plus 1 tick for a short.
- 1R = the distance between entry and stop. The +1R level is not drawn: it is entry plus 1R for a long, minus 1R for a short.
- The two lines together are the setup bar's range. For an inside bar (3-1-2, 2-1-2) the other side of that range is the opposite trade. The indicator draws only the side picked by the inside bar's colour, and the first side to break is the trade.
- For a TRIGGERED setup, the setup bar is the one before the trigger bar. The entry line is the level the trigger bar already broke, and the stop is that setup bar's far side.
How to use them
1. Check the dashboard for a row that is in play or TRIGGERED, and note the FTFC banner.
2. Set Overlay TF to that row's timeframe. The lines appear.
3. Compare the line distance with the Risk% column to see whether this setup bar is unusually wide or narrow for its type.
4. Watch price against the entry line yourself. The dashboard updates only when a higher-timeframe bar closes, so it will not tell you the moment a level breaks.
5. Use the dividers to see how far into the current HTF candle you are.
The lines disappear when the overlay timeframe is None, is shorter than the chart timeframe, or has no setup with a direction. Only one timeframe has lines at a time.
4. THE DASHBOARD AND STATS COLUMNS
The dashboard has one row per timeframe. Its left half describes the live Strat state. Its right half gives the history of that same state on NQ. Most historical rates sit close to 50%, so read the numbers as context and as a way to size risk, not as a signal.
LIVE COLUMNS
- Banner: FTFC verdict across the timeframes that are valid on your chart: ALIGNED ▲, ALIGNED ▼ or MIXED, with a count of ▲ and ▼.
- TF: 15m, 30m, 1h, 4h, 1D or 1W. A timeframe shorter than the chart shows "—" in every column.
- Dir: direction of the last closed candle (teal ▲, red ▼), or price against the timeframe's open if Live FTFC is on.
- Seq: the last three closed bar types, oldest on the left, for example 3·1·2U.
- Setup: pattern name and direction arrow. After a TRIGGERED pattern, a second line starting ▸ shows the in-play setup the same bar creates.
- Trigger: the price level that triggers the trade: the setup bar's high for a long, its low for a short. For a TRIGGERED row, the level the trigger bar broke. The chart lines add the 1-tick buffer.
- Status: "in play" (amber) means the setup bar has closed. "TRIGGERED" (teal or red fill) means a single-sided trigger bar has closed.
- ±FTFC: ✓ if the row's direction agrees with the overall continuity lean, ✗ if it opposes it.
STATISTICS COLUMNS (NQ and MNQ only)
- 1st%: how often the displayed side of the setup bar breaks first, out of every occurrence of this setup. The tooltip also gives the other side and "neither". Not shown on TRIGGERED rows.
- n: number of historical trades for this exact pattern, side and timeframe. Shown on TRIGGERED rows.
- +1R%: of the trades that resolved inside the 3-bar window (reached +1R or hit the stop), the share that reached +1R first. 1R is the entry-to-stop distance. Not shown on TRIGGERED rows.
- CB%: share of trades where the trigger bar closed beyond the trigger level. Not shown on TRIGGERED rows.
- Risk%: median entry-to-stop distance as a percentage of price. At 21,000, 0.22% is about 46 points. Shown on TRIGGERED rows.
WHICH POPULATION EACH ROW USES
A statistic only makes sense for the moment it is shown at, so the indicator reads from three separate sets of trades.
- In play: every trade where this side of the setup bar broke first, whatever the trigger bar did afterwards. Read it as "if this side breaks first".
- In play, inside setup bar (3-1-2, 2-1-2): the same, restricted to inside bars whose colour picks the displayed side (close at or above open = long).
- TRIGGERED: trades whose trigger bar was single-sided (2U or 2D). Only n and Risk% are shown, because the trigger bar has already played and history measured from entry overstates what is left.
READING THE MARKS
- Grey text means fewer than 100 trades resolved in that cell. Treat it as noise. Almost every 1D and 1W cell is grey.
- ↑ or ↓ after +1R% or CB% means the cell differs from its baseline by more than chance would explain, after correcting for the many cells tested (q below 0.10). ↓ is below the baseline, ↑ above it. A cell with no mark is indistinguishable from its baseline.
- Across the 270 in-play cells, 19 carry a mark and all 19 are ↓. None is ↑. Consecutive events overlap, which makes even these q-values optimistic.
BASELINES FOR CONTEXT
These are the averages over every first-break trade, with no pattern filter. A pattern's number only means something against the matching row. Each line shows: timeframe, number of trades, +1R% long / short, CB% long / short, median Risk%.
- 15m: 113,493 trades; +1R 50.5 / 51.7; CB 51.0 / 48.5; Risk 0.13%
- 30m: 56,807 trades; +1R 51.6 / 51.7; CB 51.9 / 47.6; Risk 0.18%
- 1h: 28,444 trades; +1R 52.2 / 51.7; CB 52.5 / 47.1; Risk 0.26%
- 4h: 7,304 trades; +1R 52.7 / 52.3; CB 55.3 / 48.1; Risk 0.57%
- 1D: 1,312 trades; +1R 51.1 / 51.4; CB 56.1 / 46.3; Risk 1.7% / 1.8%
- 1W: 273 trades; +1R 57.0 / 42.6; CB 62.6 / 47.3; Risk 4.0% / 4.3%
Longs close beyond their trigger more often than shorts in every row, because NQ rose over the sample. The 1W row rests on 273 trades in total and is not reliable.
WORKED EXAMPLES
An inside bar after an outside bar, 1h, long. The row reads 1st% 63, n 239, +1R% 57.5, CB% 57.7, Risk% 0.22. The long side broke first in 63% of 378 occurrences, the short side in 24%, and neither in 13%. Of the 239 long trades, 146 resolved, and 57.5% of those reached +1R before the stop, against 51.6% for all longs that follow an up or flat setup bar. That gap is not statistically distinguishable (q = 0.45), so there is no mark. The useful facts are the 63% and the 0.22% stop.
PMG with a run of 3, 15m, long. The row reads 1st% 37, n 3,247, +1R% 46.6↓. After three lower lows, the long side broke first only 37% of the time while the run continued down 46% of the time. The reversal long reached +1R first 46.6% of the time against 50.5% for any long, and that shortfall is the one the test flags (q = 0.008).
A TRIGGERED row. It shows only n and Risk%. Use the n to see how common the pattern is and the Risk% to compare the chart's stop distance with a typical one.
HOVER FOR DETAIL
Every stats cell has a tooltip with the study cell key (previous bar → setup bar, side), the population, the first-break shares, trades and resolved trades, +1R% against the population baseline, CB% against both the time-of-day-matched expectation and the baseline, the share of trades that touched the stop inside 3 bars, the median stop distance, both q-values, and a thin-sample warning where it applies.
5. HOW THE STATS WERE GENERATED
Every number in the table was measured offline in Python from 5.8 years of NQ one-minute data, then embedded in the script as fixed lookup tables. The indicator calculates no statistics live and fetches no data.
DATA
- Source: NQ continuous futures, one-minute open, high, low and close, 2,040,268 rows from 2019-06-02 18:00 to 2025-03-14 16:59. Times are the vendor's clock, treated as US Eastern, where the CME session opens at 18:00.
- Contract rolls: the file is an unadjusted continuous contract. In each of the 24 quarterly roll windows the largest one-minute jump in the hour or two after the session open was located, and the 20 jumps larger than 20 ticks were back-adjusted so a roll gap cannot create a false 2U, 2D or outside bar. The four smaller jumps (2 to 4 points) were left alone.
- Percent measures: distances are expressed against the unadjusted closing price of the setup bar, because the back-adjusted series is shifted by cumulative roll gaps.
BARS
Bars are rebuilt from the one-minute data, anchored at the 18:00 session open: 4h bars start at 18:00, 22:00, 02:00 and so on; a daily bar runs 18:00 to 17:59; a weekly bar starts Sunday 18:00. A bar with fewer than 60% of the usual one-minute prints for its time slot in the same calendar quarter is treated as a stub (holiday or early close) and excluded. Bar types use strict highs and lows, and equal values are not breaks. As a check, the type derived from the one-minute path matches the bar-level type for every bar.
Each line shows: timeframe, bars, stub bars dropped, first-break trades.
- 15m: 136,160 bars; 132 dropped; 113,493 trades
- 30m: 68,349 bars; 88 dropped; 56,807 trades
- 1h: 34,185 bars; 55 dropped; 28,444 trades
- 4h: 8,918 bars; 13 dropped; 7,304 trades
- 1D: 1,496 bars; 2 dropped; 1,312 trades
- 1W: 302 bars; 1 dropped; 273 trades
WHAT COUNTS AS A TRADE
For every pair of consecutive bars, the first is the setup bar and the second is the trigger bar. The one-minute path of the trigger bar decides which side of the setup bar broke first.
- Entry: the setup bar's high plus 1 tick (long) or low minus 1 tick (short). If the minute opens beyond that, the open is used.
- Stop: the far side of the setup bar, minus or plus 1 tick.
- 1R: the distance from entry to stop.
- Window: the trigger bar plus the next two bars, starting the minute after entry.
- Outcome: +1R first, stop first, or neither inside the window. If one minute touches both, the stop wins.
- Excluded: trigger bars that stay inside the setup bar, and the few where both sides break in the same minute (634 of 15m events, 5 of 4h).
The measures follow directly. n counts trades. +1R% is trades that reached +1R first divided by trades that resolved. CB% is the share whose trigger bar closed beyond the trigger level. Risk% is the median of 100 × 1R divided by price. 1st%, the other-side share and the neither share are counted over every occurrence of the setup, including those where the trigger bar stayed inside.
POPULATIONS, BASELINES AND SIGNIFICANCE
- Populations: the three sets of trades in section 4 are tabulated separately, each with its own baseline for each timeframe and side: all trades, trades with a single-sided trigger bar, and trades after an inside setup bar whose colour matches the side.
- Baselines: +1R% is compared with the baseline rate for the same timeframe, side and population. CB% is also compared with a baseline matched on side and time-of-day slot, because the share of closes beyond a level varies a lot between, say, the Asian session and the New York open.
- Significance: each cell is tested against its baseline with a z-test, and the p-values are corrected across all cells of the same population with the Benjamini-Hochberg method (q). Cells with fewer than 100 trades are not tested. A mark appears at q below 0.10.
- Overlap: consecutive bars share data, so events are not independent and the q-values are optimistic.
- PMG: a run of N same-direction 2 bars, N = 2, 3 or 4, followed by a trade in the opposite direction. The buckets are cumulative: N = 3 includes runs of 4.
WHAT THE WIDER STUDY FOUND
The indicator is built on a larger descriptive study of the Strat on NQ (7 timeframes from 15m to 8h, with bar-type frequencies, transitions, colour, time of day and year-by-year splits). Its main results:
- Bar types are not random: for example, a 2U bar is far more likely to be green, and the mix of types changes by time of day.
- Among 155 named-pattern cells, none was flagged against its baseline. Among 186 testable setup-map cells, no more than five were flagged, and none was above baseline.
- +1R first sits between roughly 48% and 53% in most cells with enough trades.
- Colour continuity across timeframes showed no consistent effect.
HOW IT WAS CHECKED
- All 495 embedded values were compared with the Python output, with no mismatches.
- A second, independently written implementation, working only from the one-minute data and the rules above, reproduced the trade counts and rates for the 1h and 4h baselines and several individual cells exactly.
- The indicator's setup logic was compared with the Python study bar by bar. Bar classification matched on every bar, and the pattern logic matched the original script across tens of thousands of test cases.
6. LIMITATIONS, ASSUMPTIONS AND DISCLAIMER
The statistics describe what NQ did in one 5.8-year sample, under specific bar and data assumptions. They are not a forecast, and the indicator is not trading advice.
ASSUMPTIONS ABOUT YOUR CHART
- HTF bars open at 18:00 ET (the CME session open). Different bar boundaries, such as a 4h grid offset by 2 or 3 hours, change a large share of bar types, and the table no longer matches the study.
- The contract is back-adjusted, or roll gaps are small. An unadjusted continuous contract can show a false 2U, 2D or outside bar at a roll. In the study this affected 0.01% to 1.3% of bars, depending on timeframe.
- Holiday and early-close bars are rare. The study drops stub bars. TradingView keeps them, so a few patterns will appear that the study never counted.
- The symbol is NQ or MNQ. The columns are hidden on other symbols unless you override them, and the numbers were not measured there.
WHAT THE INDICATOR CANNOT DO
- Intrabar triggers: setups and statuses update when a higher-timeframe bar closes. A level can break well before the table says TRIGGERED.
- Gap entries: the study enters at the open if a minute opens beyond the trigger level. The chart lines cannot know that, so they show the level plus or minus 1 tick. This affected about 1% of 1h and 2% of 4h trades.
- Outcome statistics for TRIGGERED rows: only n and Risk% are shown, by design.
- Live FTFC repaints while the bar forms. Everything else is closed-bar.
- Refresh its own statistics: the tables are fixed as of 2025-03-14. New data requires re-running the study and rebuilding the script.
LIMITS OF THE STATISTICS
- One market, one regime: the sample is NQ in a rising market over a rate cycle. Rates for longs and shorts differ partly for that reason.
- Thin cells: 1D has about 1,300 trades in total and 1W about 270. Most of their cells are grey and some are empty. Treat them as illustrations.
- Overlap and multiple testing: neighbouring events share bars, and hundreds of cells were tested. The ↑ and ↓ marks are weak evidence, and an unmarked cell is not proof that a pattern has no effect.
- Naming: the indicator's "2-2" means a reversal after a 2U or 2D, and its "3-2-2" requires an outside bar before. They are narrower than the study's broader "2-2" family. The tooltip always names the exact cell, such as "2D → 2U, short".
- Setup order: switching a setup off can relabel its bars as a later pattern. The numbers still follow the real bar sequence.
DISCLAIMER
This indicator and its statistics are provided for education and information only. They are not investment advice or a recommendation to trade. Futures trading carries a substantial risk of loss. Historical results, including every figure in this guide, do not guarantee future results. You are responsible for your own decisions.
Strat · HTF shows the Strat state of six higher timeframes (15m, 30m, 1h, 4h, 1D, 1W) in one dashboard, draws a chosen timeframe as floating candles with entry and stop levels, and attaches historical NQ statistics to every live setup. It describes what the chart is doing. It does not tell you to buy or sell.
1. WHAT THE INDICATOR DOES
The Strat in one paragraph. Every bar is classified by how its high and low compare with the previous bar's. Equal highs or lows are not breaks.
- 1 = Inside: neither the previous high nor low was broken
- 2U = Two up: only the previous high was broken
- 2D = Two down: only the previous low was broken
- 3 = Outside: both the previous high and low were broken
Setups it detects. A setup is a short sequence of bars. The last closed bar is the "setup bar". The next bar is the "trigger bar": whichever side of the setup bar it breaks first is the trade.
- 3-1-2: outside bar, then inside bar. Side is set by the inside bar's colour (up or flat = long, down = short).
- 2-1-2c / 2-1-2r: a 2U or 2D, then an inside bar. Same side rule. "c" breaks in the direction of the first 2 (continuation), "r" against it (reversal).
- 2-2: a 2U or 2D, then the opposite 2. Reversal of the last closed bar.
- 3-2-2: outside bar, then a 2U or 2D. Reversal of the last closed bar.
- 1-2-2: inside bar, then a 2U or 2D. Reversal of the last closed bar (the "rev strat").
- PMG: a run of N same-direction 2 bars (N = 2 to 4). Reversal of the run.
Two states. A row is "in play" when the setup bar has closed and the trigger bar has not happened yet. It becomes "TRIGGERED" when the last closed bar is a single-sided trigger bar (2U or 2D) that completed one of the patterns above. The in-play setup that the same closed bar creates is shown beside it, on a second line starting with ▸.
What you get on the chart:
- A dashboard with one row per timeframe and a full-timeframe-continuity (FTFC) banner.
- Optional floating HTF candles to the right of price, with Strat numbers and setup labels.
- Dotted dividers on the real price chart at each HTF boundary.
- Entry and stop lines for the setup on the overlay timeframe.
- Five statistics columns (1st%, n, +1R%, CB%, Risk%) with a hover tooltip, measured on NQ.
- Two alerts: a new setup triggering on any timeframe, and full timeframe continuity.
Everything is calculated from closed higher-timeframe bars, so setups do not repaint. The one exception is the optional "Live FTFC" setting (section 2).
2. CONFIGURING THE INDICATOR
The defaults work on an NQ chart at 15 minutes or lower. Open the settings with the gear icon on the indicator's name. The inputs sit in four groups.
Quick start. Use a chart timeframe at or below 15m so all six rows are live (rows for timeframes shorter than the chart show "—"). Set "Overlay TF" to the timeframe you are watching. Leave the stats columns on, and hover cells for detail.
SETUPS
- PMG run length (default 3, range 2 to 4): how many consecutive same-direction 2 bars make a PMG.
- 2-2 reversal, 2-1-2, 3-1-2, 1-2-2, 3-2-2, PMG (all on by default): switch each setup on or off.
Setups are checked in this order: PMG, 3-1-2, 2-1-2, 3-2-2, 1-2-2, 2-2. If you switch a setup off, its bars can fall through to a later name (for example, with 3-2-2 off the same bars are labelled 2-2). The statistics always follow the actual bar pattern, and the tooltip names the exact study cell.
DASHBOARD
- Show dashboard (on): shows or hides the table.
- Live FTFC (off): off = the Dir column uses the last closed candle's colour (stable). On = it uses current price against each timeframe's open, the classic FTFC, and repaints while the bar forms.
- Continuity column (on): adds a ± column. ✓ if the row's setup points with the overall continuity, ✗ if against.
- Historical stats columns (on): adds 1st%, n, +1R%, CB%, Risk% (section 4).
- Show stats on non-NQ symbols (off): the numbers were measured on NQ only. Tick this only if you accept applying them elsewhere.
- Position (Top, Right): where the table sits.
- Text size, Monospace font (Small, on): table typography.
- Colours: text, muted text, cell and header backgrounds, up and down (teal and red), in play (amber), text on colour, border and frame.
The stats columns only appear when the symbol is NQ or MNQ, unless you tick the override.
HTF OVERLAY
- Overlay TF (None): None, 15m, 30m, 1h, 4h, 1D or 1W. Must be equal to or higher than the chart timeframe. It also sets the timeframe used for entry and stop lines.
- Candles to draw (10, range 2 to 40): number of floating HTF candles.
- Offset from price (8 bars): gap between the last real bar and the cluster.
- Candle spacing (4, range 3 to 12): horizontal room per candle.
- Auto-fit height (on): scales the cluster to a readable height.
- Auto-fit target in ATRs (25): target cluster height as a multiple of the chart's ATR(14).
- Manual height scale (0.5): used when auto-fit is off (1 = true price height).
- Strat number labels (on): shows 1, 2U, 2D or 3 above each candle.
- Setup labels (on): shows the completed pattern name below the trigger candle.
- Colours: body, border, wick, number text, setup text.
- TF dividers on price chart (on): dotted vertical lines at each overlay-timeframe boundary, at true price.
- Divider colour, style, width, count (grey, dotted, 1, 20): the number of dividers to keep ranges from 2 to 60.
LEVELS
- Draw entry / stop levels (on): draws levels for the overlay timeframe's current setup. Needs an Overlay TF other than None.
- Long trig / short stop colour (teal) and Short trig / long stop colour (red).
- Line width (1).
- Extend in bars (30, range 5 to 200): how far the lines run to the right.
ALERTS
Choose "Create alert", then pick Strat · HTF as the condition. Two alerts are available:
- Any HTF setup triggered: fires once for each new trigger on any of the six timeframes, not on every chart bar while the state lasts.
- Full timeframe continuity: fires while all valid timeframes are aligned.
3. LINES AND LEVELS ON THE CHART
Three things are drawn on the chart: the floating HTF candles, dotted dividers at true price, and entry and stop lines. All three follow the "Overlay TF" setting, so set it to the timeframe you are watching.
- Floating HTF candles: the overlay timeframe's last N candles, rebuilt from chart bars. They sit to the right of the last bar, newest at the right edge. Use them to see the Strat sequence at a glance.
- Strat numbers: 1, 2U, 2D or 3 above each candle. They save you counting highs and lows.
- Setup labels: the pattern name and ▲ or ▼ below the candle that completed the pattern. They show where past patterns triggered.
- TF dividers: dotted vertical lines at each overlay-timeframe boundary, on the real price chart at true price. They show where each HTF candle begins and ends.
- Entry line: a solid line in the trade's colour (teal long, red short) at the trigger level, plus or minus 1 tick. It shows where the trade triggers.
- Stop line: a grey dashed line at the far side of the setup bar, plus or minus 1 tick. It shows where the setup fails and how big 1R is.
Floating HTF candles
The cluster is compressed vertically to a readable height, so do not read prices from it. Use the dividers and the entry and stop lines, which sit at true price. The newest candle is still forming: its number and any setup label can change until the bar closes. Older candles are final.
Entry and stop lines
The lines are drawn for the overlay timeframe's current setup, in play or TRIGGERED. They start at the beginning of the last closed overlay-timeframe candle and run 30 bars to the right (adjustable). Two labels sit at their right end, for example "1h ▲ long 21345.25 2-2" on the entry line and "stop 21300.00" on the stop line.
They follow the same definitions as the study (section 5):
- Entry = the setup bar's high plus 1 tick for a long, or its low minus 1 tick for a short.
- Stop = the setup bar's opposite extreme, minus 1 tick for a long or plus 1 tick for a short.
- 1R = the distance between entry and stop. The +1R level is not drawn: it is entry plus 1R for a long, minus 1R for a short.
- The two lines together are the setup bar's range. For an inside bar (3-1-2, 2-1-2) the other side of that range is the opposite trade. The indicator draws only the side picked by the inside bar's colour, and the first side to break is the trade.
- For a TRIGGERED setup, the setup bar is the one before the trigger bar. The entry line is the level the trigger bar already broke, and the stop is that setup bar's far side.
How to use them
1. Check the dashboard for a row that is in play or TRIGGERED, and note the FTFC banner.
2. Set Overlay TF to that row's timeframe. The lines appear.
3. Compare the line distance with the Risk% column to see whether this setup bar is unusually wide or narrow for its type.
4. Watch price against the entry line yourself. The dashboard updates only when a higher-timeframe bar closes, so it will not tell you the moment a level breaks.
5. Use the dividers to see how far into the current HTF candle you are.
The lines disappear when the overlay timeframe is None, is shorter than the chart timeframe, or has no setup with a direction. Only one timeframe has lines at a time.
4. THE DASHBOARD AND STATS COLUMNS
The dashboard has one row per timeframe. Its left half describes the live Strat state. Its right half gives the history of that same state on NQ. Most historical rates sit close to 50%, so read the numbers as context and as a way to size risk, not as a signal.
LIVE COLUMNS
- Banner: FTFC verdict across the timeframes that are valid on your chart: ALIGNED ▲, ALIGNED ▼ or MIXED, with a count of ▲ and ▼.
- TF: 15m, 30m, 1h, 4h, 1D or 1W. A timeframe shorter than the chart shows "—" in every column.
- Dir: direction of the last closed candle (teal ▲, red ▼), or price against the timeframe's open if Live FTFC is on.
- Seq: the last three closed bar types, oldest on the left, for example 3·1·2U.
- Setup: pattern name and direction arrow. After a TRIGGERED pattern, a second line starting ▸ shows the in-play setup the same bar creates.
- Trigger: the price level that triggers the trade: the setup bar's high for a long, its low for a short. For a TRIGGERED row, the level the trigger bar broke. The chart lines add the 1-tick buffer.
- Status: "in play" (amber) means the setup bar has closed. "TRIGGERED" (teal or red fill) means a single-sided trigger bar has closed.
- ±FTFC: ✓ if the row's direction agrees with the overall continuity lean, ✗ if it opposes it.
STATISTICS COLUMNS (NQ and MNQ only)
- 1st%: how often the displayed side of the setup bar breaks first, out of every occurrence of this setup. The tooltip also gives the other side and "neither". Not shown on TRIGGERED rows.
- n: number of historical trades for this exact pattern, side and timeframe. Shown on TRIGGERED rows.
- +1R%: of the trades that resolved inside the 3-bar window (reached +1R or hit the stop), the share that reached +1R first. 1R is the entry-to-stop distance. Not shown on TRIGGERED rows.
- CB%: share of trades where the trigger bar closed beyond the trigger level. Not shown on TRIGGERED rows.
- Risk%: median entry-to-stop distance as a percentage of price. At 21,000, 0.22% is about 46 points. Shown on TRIGGERED rows.
WHICH POPULATION EACH ROW USES
A statistic only makes sense for the moment it is shown at, so the indicator reads from three separate sets of trades.
- In play: every trade where this side of the setup bar broke first, whatever the trigger bar did afterwards. Read it as "if this side breaks first".
- In play, inside setup bar (3-1-2, 2-1-2): the same, restricted to inside bars whose colour picks the displayed side (close at or above open = long).
- TRIGGERED: trades whose trigger bar was single-sided (2U or 2D). Only n and Risk% are shown, because the trigger bar has already played and history measured from entry overstates what is left.
READING THE MARKS
- Grey text means fewer than 100 trades resolved in that cell. Treat it as noise. Almost every 1D and 1W cell is grey.
- ↑ or ↓ after +1R% or CB% means the cell differs from its baseline by more than chance would explain, after correcting for the many cells tested (q below 0.10). ↓ is below the baseline, ↑ above it. A cell with no mark is indistinguishable from its baseline.
- Across the 270 in-play cells, 19 carry a mark and all 19 are ↓. None is ↑. Consecutive events overlap, which makes even these q-values optimistic.
BASELINES FOR CONTEXT
These are the averages over every first-break trade, with no pattern filter. A pattern's number only means something against the matching row. Each line shows: timeframe, number of trades, +1R% long / short, CB% long / short, median Risk%.
- 15m: 113,493 trades; +1R 50.5 / 51.7; CB 51.0 / 48.5; Risk 0.13%
- 30m: 56,807 trades; +1R 51.6 / 51.7; CB 51.9 / 47.6; Risk 0.18%
- 1h: 28,444 trades; +1R 52.2 / 51.7; CB 52.5 / 47.1; Risk 0.26%
- 4h: 7,304 trades; +1R 52.7 / 52.3; CB 55.3 / 48.1; Risk 0.57%
- 1D: 1,312 trades; +1R 51.1 / 51.4; CB 56.1 / 46.3; Risk 1.7% / 1.8%
- 1W: 273 trades; +1R 57.0 / 42.6; CB 62.6 / 47.3; Risk 4.0% / 4.3%
Longs close beyond their trigger more often than shorts in every row, because NQ rose over the sample. The 1W row rests on 273 trades in total and is not reliable.
WORKED EXAMPLES
An inside bar after an outside bar, 1h, long. The row reads 1st% 63, n 239, +1R% 57.5, CB% 57.7, Risk% 0.22. The long side broke first in 63% of 378 occurrences, the short side in 24%, and neither in 13%. Of the 239 long trades, 146 resolved, and 57.5% of those reached +1R before the stop, against 51.6% for all longs that follow an up or flat setup bar. That gap is not statistically distinguishable (q = 0.45), so there is no mark. The useful facts are the 63% and the 0.22% stop.
PMG with a run of 3, 15m, long. The row reads 1st% 37, n 3,247, +1R% 46.6↓. After three lower lows, the long side broke first only 37% of the time while the run continued down 46% of the time. The reversal long reached +1R first 46.6% of the time against 50.5% for any long, and that shortfall is the one the test flags (q = 0.008).
A TRIGGERED row. It shows only n and Risk%. Use the n to see how common the pattern is and the Risk% to compare the chart's stop distance with a typical one.
HOVER FOR DETAIL
Every stats cell has a tooltip with the study cell key (previous bar → setup bar, side), the population, the first-break shares, trades and resolved trades, +1R% against the population baseline, CB% against both the time-of-day-matched expectation and the baseline, the share of trades that touched the stop inside 3 bars, the median stop distance, both q-values, and a thin-sample warning where it applies.
5. HOW THE STATS WERE GENERATED
Every number in the table was measured offline in Python from 5.8 years of NQ one-minute data, then embedded in the script as fixed lookup tables. The indicator calculates no statistics live and fetches no data.
DATA
- Source: NQ continuous futures, one-minute open, high, low and close, 2,040,268 rows from 2019-06-02 18:00 to 2025-03-14 16:59. Times are the vendor's clock, treated as US Eastern, where the CME session opens at 18:00.
- Contract rolls: the file is an unadjusted continuous contract. In each of the 24 quarterly roll windows the largest one-minute jump in the hour or two after the session open was located, and the 20 jumps larger than 20 ticks were back-adjusted so a roll gap cannot create a false 2U, 2D or outside bar. The four smaller jumps (2 to 4 points) were left alone.
- Percent measures: distances are expressed against the unadjusted closing price of the setup bar, because the back-adjusted series is shifted by cumulative roll gaps.
BARS
Bars are rebuilt from the one-minute data, anchored at the 18:00 session open: 4h bars start at 18:00, 22:00, 02:00 and so on; a daily bar runs 18:00 to 17:59; a weekly bar starts Sunday 18:00. A bar with fewer than 60% of the usual one-minute prints for its time slot in the same calendar quarter is treated as a stub (holiday or early close) and excluded. Bar types use strict highs and lows, and equal values are not breaks. As a check, the type derived from the one-minute path matches the bar-level type for every bar.
Each line shows: timeframe, bars, stub bars dropped, first-break trades.
- 15m: 136,160 bars; 132 dropped; 113,493 trades
- 30m: 68,349 bars; 88 dropped; 56,807 trades
- 1h: 34,185 bars; 55 dropped; 28,444 trades
- 4h: 8,918 bars; 13 dropped; 7,304 trades
- 1D: 1,496 bars; 2 dropped; 1,312 trades
- 1W: 302 bars; 1 dropped; 273 trades
WHAT COUNTS AS A TRADE
For every pair of consecutive bars, the first is the setup bar and the second is the trigger bar. The one-minute path of the trigger bar decides which side of the setup bar broke first.
- Entry: the setup bar's high plus 1 tick (long) or low minus 1 tick (short). If the minute opens beyond that, the open is used.
- Stop: the far side of the setup bar, minus or plus 1 tick.
- 1R: the distance from entry to stop.
- Window: the trigger bar plus the next two bars, starting the minute after entry.
- Outcome: +1R first, stop first, or neither inside the window. If one minute touches both, the stop wins.
- Excluded: trigger bars that stay inside the setup bar, and the few where both sides break in the same minute (634 of 15m events, 5 of 4h).
The measures follow directly. n counts trades. +1R% is trades that reached +1R first divided by trades that resolved. CB% is the share whose trigger bar closed beyond the trigger level. Risk% is the median of 100 × 1R divided by price. 1st%, the other-side share and the neither share are counted over every occurrence of the setup, including those where the trigger bar stayed inside.
POPULATIONS, BASELINES AND SIGNIFICANCE
- Populations: the three sets of trades in section 4 are tabulated separately, each with its own baseline for each timeframe and side: all trades, trades with a single-sided trigger bar, and trades after an inside setup bar whose colour matches the side.
- Baselines: +1R% is compared with the baseline rate for the same timeframe, side and population. CB% is also compared with a baseline matched on side and time-of-day slot, because the share of closes beyond a level varies a lot between, say, the Asian session and the New York open.
- Significance: each cell is tested against its baseline with a z-test, and the p-values are corrected across all cells of the same population with the Benjamini-Hochberg method (q). Cells with fewer than 100 trades are not tested. A mark appears at q below 0.10.
- Overlap: consecutive bars share data, so events are not independent and the q-values are optimistic.
- PMG: a run of N same-direction 2 bars, N = 2, 3 or 4, followed by a trade in the opposite direction. The buckets are cumulative: N = 3 includes runs of 4.
WHAT THE WIDER STUDY FOUND
The indicator is built on a larger descriptive study of the Strat on NQ (7 timeframes from 15m to 8h, with bar-type frequencies, transitions, colour, time of day and year-by-year splits). Its main results:
- Bar types are not random: for example, a 2U bar is far more likely to be green, and the mix of types changes by time of day.
- Among 155 named-pattern cells, none was flagged against its baseline. Among 186 testable setup-map cells, no more than five were flagged, and none was above baseline.
- +1R first sits between roughly 48% and 53% in most cells with enough trades.
- Colour continuity across timeframes showed no consistent effect.
HOW IT WAS CHECKED
- All 495 embedded values were compared with the Python output, with no mismatches.
- A second, independently written implementation, working only from the one-minute data and the rules above, reproduced the trade counts and rates for the 1h and 4h baselines and several individual cells exactly.
- The indicator's setup logic was compared with the Python study bar by bar. Bar classification matched on every bar, and the pattern logic matched the original script across tens of thousands of test cases.
6. LIMITATIONS, ASSUMPTIONS AND DISCLAIMER
The statistics describe what NQ did in one 5.8-year sample, under specific bar and data assumptions. They are not a forecast, and the indicator is not trading advice.
ASSUMPTIONS ABOUT YOUR CHART
- HTF bars open at 18:00 ET (the CME session open). Different bar boundaries, such as a 4h grid offset by 2 or 3 hours, change a large share of bar types, and the table no longer matches the study.
- The contract is back-adjusted, or roll gaps are small. An unadjusted continuous contract can show a false 2U, 2D or outside bar at a roll. In the study this affected 0.01% to 1.3% of bars, depending on timeframe.
- Holiday and early-close bars are rare. The study drops stub bars. TradingView keeps them, so a few patterns will appear that the study never counted.
- The symbol is NQ or MNQ. The columns are hidden on other symbols unless you override them, and the numbers were not measured there.
WHAT THE INDICATOR CANNOT DO
- Intrabar triggers: setups and statuses update when a higher-timeframe bar closes. A level can break well before the table says TRIGGERED.
- Gap entries: the study enters at the open if a minute opens beyond the trigger level. The chart lines cannot know that, so they show the level plus or minus 1 tick. This affected about 1% of 1h and 2% of 4h trades.
- Outcome statistics for TRIGGERED rows: only n and Risk% are shown, by design.
- Live FTFC repaints while the bar forms. Everything else is closed-bar.
- Refresh its own statistics: the tables are fixed as of 2025-03-14. New data requires re-running the study and rebuilding the script.
LIMITS OF THE STATISTICS
- One market, one regime: the sample is NQ in a rising market over a rate cycle. Rates for longs and shorts differ partly for that reason.
- Thin cells: 1D has about 1,300 trades in total and 1W about 270. Most of their cells are grey and some are empty. Treat them as illustrations.
- Overlap and multiple testing: neighbouring events share bars, and hundreds of cells were tested. The ↑ and ↓ marks are weak evidence, and an unmarked cell is not proof that a pattern has no effect.
- Naming: the indicator's "2-2" means a reversal after a 2U or 2D, and its "3-2-2" requires an outside bar before. They are narrower than the study's broader "2-2" family. The tooltip always names the exact cell, such as "2D → 2U, short".
- Setup order: switching a setup off can relabel its bars as a later pattern. The numbers still follow the real bar sequence.
DISCLAIMER
This indicator and its statistics are provided for education and information only. They are not investment advice or a recommendation to trade. Futures trading carries a substantial risk of loss. Historical results, including every figure in this guide, do not guarantee future results. You are responsible for your own decisions.

免责声明
这些信息和出版物并非旨在提供,也不构成TradingView提供或认可的任何形式的财务、投资、交易或其他类型的建议或推荐。请阅读使用条款了解更多信息。