已更新
anchored VWAP + MTF OBs+FVGs
OVERVIEW
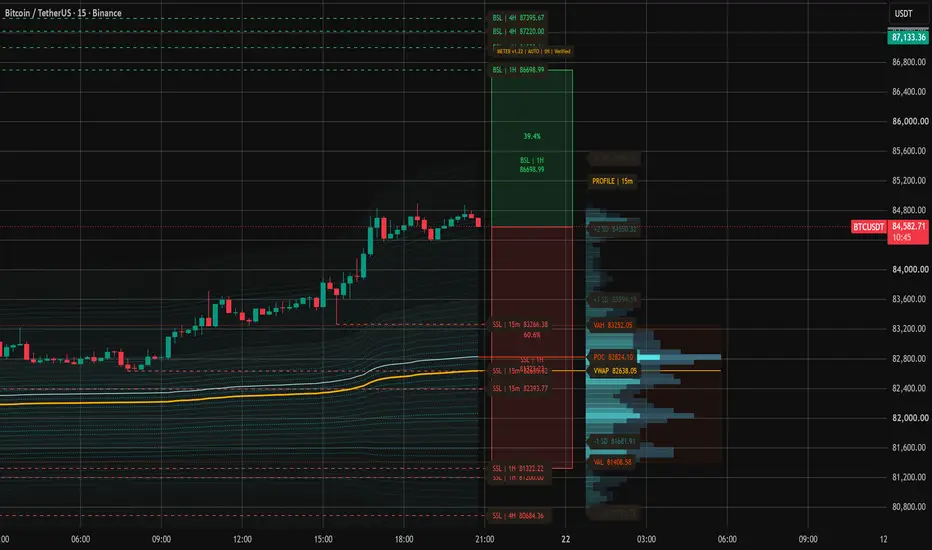
anchored VWAP + MTF OBs+FVGs combines volume-weighted price analysis, a volume profile, multi-timeframe market structure and a live liquidity distance meter.
Its purpose is to organize market context in one chart. Each component can be configured to support the trader's own analytical approach.
VWAP AND DEVIATION CHANNELS
VWAP is calculated from the beginning of a configurable source-candle window. The default window contains 300 candles and advances as new source candles become available. This is a moving lookback window, rather than a permanently fixed event anchor.
Volume-weighted standard deviation lines show price dispersion above and below VWAP.
The default Dense setting draws lines every 0.10 standard deviations, up to three standard deviations on each side. More profile volume at a line's current endpoint produces a brighter color. The highest-volume lines are solid; the others are dotted. All deviation lines use the same configurable thickness.
Optional shading fills the deviation channels.
VOLUME PROFILE
The right-hand histogram estimates the distribution of volume across the full price range of the selected source window.
It displays:
• POC — the price row with the highest estimated volume.
• VAH — the upper boundary of the value area.
• VAL — the lower boundary of the value area.
• VWAP — the volume-weighted average price.
The default value area contains approximately 70% of allocated profile volume.
Volume is estimated by distributing each candle's volume across its price range. The two histogram colors distinguish volume associated with rising and falling candles. They do not represent actual buy/sell order flow or bid/ask delta.
The profile heading identifies its source timeframe.
MULTI-TIMEFRAME ORDER BLOCKS AND FAIR VALUE GAPS
Optional order blocks and fair value gaps can be displayed from the chart timeframe and additional source timeframes.
Order blocks are identified from the last opposite candle before a confirmed structural close-break, subject to configurable filters.
Fair value gaps use a confirmed three-candle gap definition. They can be removed after first touch or full fill.
• Solid-border boxes: order blocks.
• Dashed-border boxes: fair value gaps.
• Bullish OBs: green.
• Bearish OBs: red.
• Bullish FVGs: turquoise.
• Bearish FVGs: pink.
Order blocks and fair value gaps are switched off by default.
LIQUIDITY LEVELS
BSL and SSL are inferred from confirmed swing pivots with configurable significance filters.
• BSL — buy-side liquidity associated with swing highs.
• SSL — sell-side liquidity associated with swing lows.
Levels are labeled with their source timeframe and removed when price touches them. These are inferred locations, not measurements of resting orders.
Pivots require confirmation candles. Their lines begin at the original swing only after confirmation becomes available.
LIVE LIQUIDITY DISTANCE METER
The green upper box extends from current price to the nearest eligible BSL. The red lower box extends from current price to the nearest eligible SSL.
Each box displays its percentage share of the total distance between both boundaries, together with the boundary timeframe and price.
Upper percentage:
(BSL − current price) / (BSL − SSL) × 100
Lower percentage:
(current price − SSL) / (BSL − SSL) × 100
The percentages add up to 100%. They measure distance, not the probability of reaching either boundary.
Both eligible boundaries are required. If one is missing, the meter waits instead of substituting an unselected timeframe.
AUTOMATIC AND MANUAL TIMEFRAME MODES
Automatic mode follows the chart timeframe for VWAP, deviations and the profile. It selects the following higher liquidity sources and meter source:
• 1m chart: 15m and 1H liquidity; 5m meter.
• 5m chart: 30m and 4H liquidity; 30m meter.
• 15m chart: 1H and 4H liquidity; 1H meter.
• 1H chart: 4H and 1D liquidity; 4H meter.
• 4H chart: 1D and 1W liquidity; 1D meter.
• 1D chart: 1W and 1M liquidity; 1W meter.
Chart-timeframe liquidity is also included. Intermediate chart sizes use the next configured timeframe bracket.
A 1H chart is an available starting configuration, not a requirement.
Manual mode unlocks individual source settings. For example, a trader can display a 4H profile, VWAP and deviations on a 1H chart.
The meter can independently use all enabled liquidity sources, chart-timeframe liquidity only, or selected source timeframes. Settings replaced by Automatic mode are grayed out.
DEFAULT DISPLAY
• Automatic timeframe mode.
• VWAP and shaded deviation channels enabled.
• Dense deviation grid with equal-width lines.
• Volume profile and value-area labels enabled.
• Liquidity lines and live distance meter enabled.
• Order blocks and fair value gaps disabled.
Settings are grouped by topic and include English help tooltips.
LIVE BEHAVIOR AND INTERPRETATION
The indicator updates when TradingView receives price updates. Open source candles and the developing profile can change until their candles close. A closed-source-candles option is available for the profile.
Deviation colors use the latest profile. Their historical appearance does not represent a separate volume profile calculated at every past candle.
Changing the timeframe or source-window length changes the period being analyzed. Automatic timeframe selection provides a consistent preset structure; it does not optimize a trading strategy or establish an edge.
DISCLAIMER
This indicator does not suggest or recommend entries, stop-loss levels or take-profit targets. It is an analytical and visual tool that each trader can apply in their own way to draw their own conclusions.
Different traders may interpret the same information differently and reach different, or even opposite, conclusions. No displayed level, zone, color or percentage should be treated as a guaranteed forecast or an instruction to trade.
This tool is provided for informational and educational purposes only and does not constitute financial or investment advice. It is not a backtested trading strategy, and no claim of profitability is made. Trading involves risk, including the loss of capital. Users remain responsible for their own analysis, decisions and risk management.
anchored VWAP + MTF OBs+FVGs combines volume-weighted price analysis, a volume profile, multi-timeframe market structure and a live liquidity distance meter.
Its purpose is to organize market context in one chart. Each component can be configured to support the trader's own analytical approach.
VWAP AND DEVIATION CHANNELS
VWAP is calculated from the beginning of a configurable source-candle window. The default window contains 300 candles and advances as new source candles become available. This is a moving lookback window, rather than a permanently fixed event anchor.
Volume-weighted standard deviation lines show price dispersion above and below VWAP.
The default Dense setting draws lines every 0.10 standard deviations, up to three standard deviations on each side. More profile volume at a line's current endpoint produces a brighter color. The highest-volume lines are solid; the others are dotted. All deviation lines use the same configurable thickness.
Optional shading fills the deviation channels.
VOLUME PROFILE
The right-hand histogram estimates the distribution of volume across the full price range of the selected source window.
It displays:
• POC — the price row with the highest estimated volume.
• VAH — the upper boundary of the value area.
• VAL — the lower boundary of the value area.
• VWAP — the volume-weighted average price.
The default value area contains approximately 70% of allocated profile volume.
Volume is estimated by distributing each candle's volume across its price range. The two histogram colors distinguish volume associated with rising and falling candles. They do not represent actual buy/sell order flow or bid/ask delta.
The profile heading identifies its source timeframe.
MULTI-TIMEFRAME ORDER BLOCKS AND FAIR VALUE GAPS
Optional order blocks and fair value gaps can be displayed from the chart timeframe and additional source timeframes.
Order blocks are identified from the last opposite candle before a confirmed structural close-break, subject to configurable filters.
Fair value gaps use a confirmed three-candle gap definition. They can be removed after first touch or full fill.
• Solid-border boxes: order blocks.
• Dashed-border boxes: fair value gaps.
• Bullish OBs: green.
• Bearish OBs: red.
• Bullish FVGs: turquoise.
• Bearish FVGs: pink.
Order blocks and fair value gaps are switched off by default.
LIQUIDITY LEVELS
BSL and SSL are inferred from confirmed swing pivots with configurable significance filters.
• BSL — buy-side liquidity associated with swing highs.
• SSL — sell-side liquidity associated with swing lows.
Levels are labeled with their source timeframe and removed when price touches them. These are inferred locations, not measurements of resting orders.
Pivots require confirmation candles. Their lines begin at the original swing only after confirmation becomes available.
LIVE LIQUIDITY DISTANCE METER
The green upper box extends from current price to the nearest eligible BSL. The red lower box extends from current price to the nearest eligible SSL.
Each box displays its percentage share of the total distance between both boundaries, together with the boundary timeframe and price.
Upper percentage:
(BSL − current price) / (BSL − SSL) × 100
Lower percentage:
(current price − SSL) / (BSL − SSL) × 100
The percentages add up to 100%. They measure distance, not the probability of reaching either boundary.
Both eligible boundaries are required. If one is missing, the meter waits instead of substituting an unselected timeframe.
AUTOMATIC AND MANUAL TIMEFRAME MODES
Automatic mode follows the chart timeframe for VWAP, deviations and the profile. It selects the following higher liquidity sources and meter source:
• 1m chart: 15m and 1H liquidity; 5m meter.
• 5m chart: 30m and 4H liquidity; 30m meter.
• 15m chart: 1H and 4H liquidity; 1H meter.
• 1H chart: 4H and 1D liquidity; 4H meter.
• 4H chart: 1D and 1W liquidity; 1D meter.
• 1D chart: 1W and 1M liquidity; 1W meter.
Chart-timeframe liquidity is also included. Intermediate chart sizes use the next configured timeframe bracket.
A 1H chart is an available starting configuration, not a requirement.
Manual mode unlocks individual source settings. For example, a trader can display a 4H profile, VWAP and deviations on a 1H chart.
The meter can independently use all enabled liquidity sources, chart-timeframe liquidity only, or selected source timeframes. Settings replaced by Automatic mode are grayed out.
DEFAULT DISPLAY
• Automatic timeframe mode.
• VWAP and shaded deviation channels enabled.
• Dense deviation grid with equal-width lines.
• Volume profile and value-area labels enabled.
• Liquidity lines and live distance meter enabled.
• Order blocks and fair value gaps disabled.
Settings are grouped by topic and include English help tooltips.
LIVE BEHAVIOR AND INTERPRETATION
The indicator updates when TradingView receives price updates. Open source candles and the developing profile can change until their candles close. A closed-source-candles option is available for the profile.
Deviation colors use the latest profile. Their historical appearance does not represent a separate volume profile calculated at every past candle.
Changing the timeframe or source-window length changes the period being analyzed. Automatic timeframe selection provides a consistent preset structure; it does not optimize a trading strategy or establish an edge.
DISCLAIMER
This indicator does not suggest or recommend entries, stop-loss levels or take-profit targets. It is an analytical and visual tool that each trader can apply in their own way to draw their own conclusions.
Different traders may interpret the same information differently and reach different, or even opposite, conclusions. No displayed level, zone, color or percentage should be treated as a guaranteed forecast or an instruction to trade.
This tool is provided for informational and educational purposes only and does not constitute financial or investment advice. It is not a backtested trading strategy, and no claim of profitability is made. Trading involves risk, including the loss of capital. Users remain responsible for their own analysis, decisions and risk management.
版本注释
updated chart image
免责声明
这些信息和出版物并非旨在提供,也不构成TradingView提供或认可的任何形式的财务、投资、交易或其他类型的建议或推荐。请阅读使用条款了解更多信息。
免责声明
这些信息和出版物并非旨在提供,也不构成TradingView提供或认可的任何形式的财务、投资、交易或其他类型的建议或推荐。请阅读使用条款了解更多信息。