OPEN-SOURCE SCRIPT
Dynamic Pivot Structure [DPS]
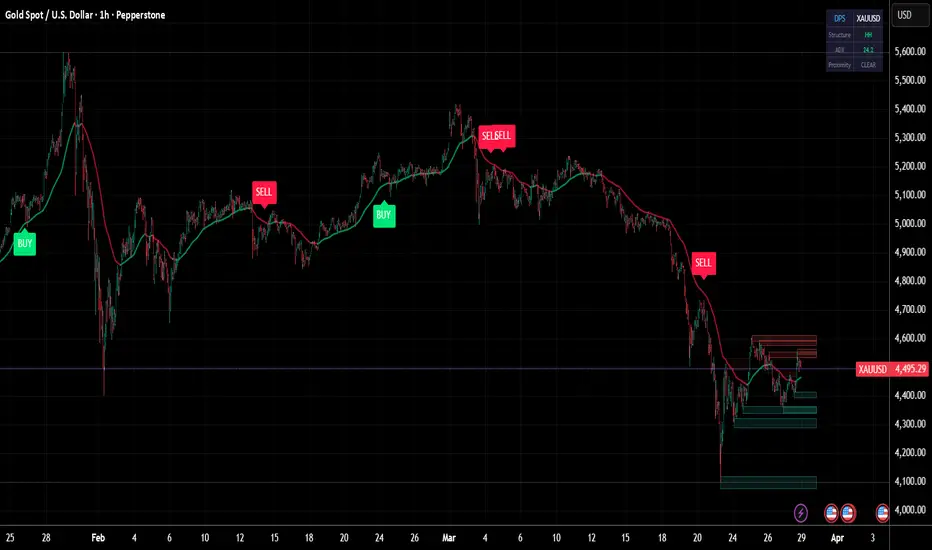
Dynamic Pivot Structure (DPS) is a price structure analysis tool that automatically detects pivot points, classifies market structure (HH, HL, LH, LL), and generates dynamic support/resistance zones with mitigation tracking.

**Mathematical Foundation:**
The indicator uses the standard pivot point detection algorithm with configurable left and right bar confirmations. A pivot high is confirmed when the high of a bar is greater than the highs of all N bars to its left and N bars to its right. Similarly for pivot lows. This provides mathematically validated local extremes rather than arbitrary level selection.
Market structure classification follows the Dow Theory framework: Higher Highs (HH) and Higher Lows (HL) define uptrends; Lower Highs (LH) and Lower Lows (LL) define downtrends. The indicator tracks consecutive pivot sequences and labels each new pivot with its structural classification.

Support and resistance zones are generated around each pivot using the Average True Range (ATR) for zone width. This creates proportional zones that automatically adjust to the instrument's volatility. The indicator tracks zone mitigation — when price penetrates a zone, it is marked as mitigated and visually faded.
**Signal Logic:**
Buy signals fire when price is near an unmitigated support zone, above the trend EMA, with RSI below 40 or bullish structure (HH/HL), and ADX confirming a trending environment. Sell signals fire near resistance with bearish conditions.

**Features:**
- Automatic pivot high/low detection with adjustable sensitivity
- Market structure classification (HH, HL, LH, LL)
- Dynamic ATR-based support and resistance zones
- Zone mitigation tracking with visual feedback
- ADX trend strength filter
- Trend EMA overlay
- Dashboard showing structure type, ADX, and proximity status
**Mathematical Foundation:**
The indicator uses the standard pivot point detection algorithm with configurable left and right bar confirmations. A pivot high is confirmed when the high of a bar is greater than the highs of all N bars to its left and N bars to its right. Similarly for pivot lows. This provides mathematically validated local extremes rather than arbitrary level selection.
Market structure classification follows the Dow Theory framework: Higher Highs (HH) and Higher Lows (HL) define uptrends; Lower Highs (LH) and Lower Lows (LL) define downtrends. The indicator tracks consecutive pivot sequences and labels each new pivot with its structural classification.
Support and resistance zones are generated around each pivot using the Average True Range (ATR) for zone width. This creates proportional zones that automatically adjust to the instrument's volatility. The indicator tracks zone mitigation — when price penetrates a zone, it is marked as mitigated and visually faded.
**Signal Logic:**
Buy signals fire when price is near an unmitigated support zone, above the trend EMA, with RSI below 40 or bullish structure (HH/HL), and ADX confirming a trending environment. Sell signals fire near resistance with bearish conditions.
**Features:**
- Automatic pivot high/low detection with adjustable sensitivity
- Market structure classification (HH, HL, LH, LL)
- Dynamic ATR-based support and resistance zones
- Zone mitigation tracking with visual feedback
- ADX trend strength filter
- Trend EMA overlay
- Dashboard showing structure type, ADX, and proximity status
开源脚本
秉承TradingView的精神,该脚本的作者将其开源,以便交易者可以查看和验证其功能。向作者致敬!您可以免费使用该脚本,但请记住,重新发布代码须遵守我们的网站规则。

免责声明
这些信息和出版物并非旨在提供,也不构成TradingView提供或认可的任何形式的财务、投资、交易或其他类型的建议或推荐。请阅读使用条款了解更多信息。
开源脚本
秉承TradingView的精神,该脚本的作者将其开源,以便交易者可以查看和验证其功能。向作者致敬!您可以免费使用该脚本,但请记住,重新发布代码须遵守我们的网站规则。
免责声明
这些信息和出版物并非旨在提供,也不构成TradingView提供或认可的任何形式的财务、投资、交易或其他类型的建议或推荐。请阅读使用条款了解更多信息。