OPEN-SOURCE SCRIPT
RSI Swing Structure Indicator (HH, LH, HL, LL + Alerts)
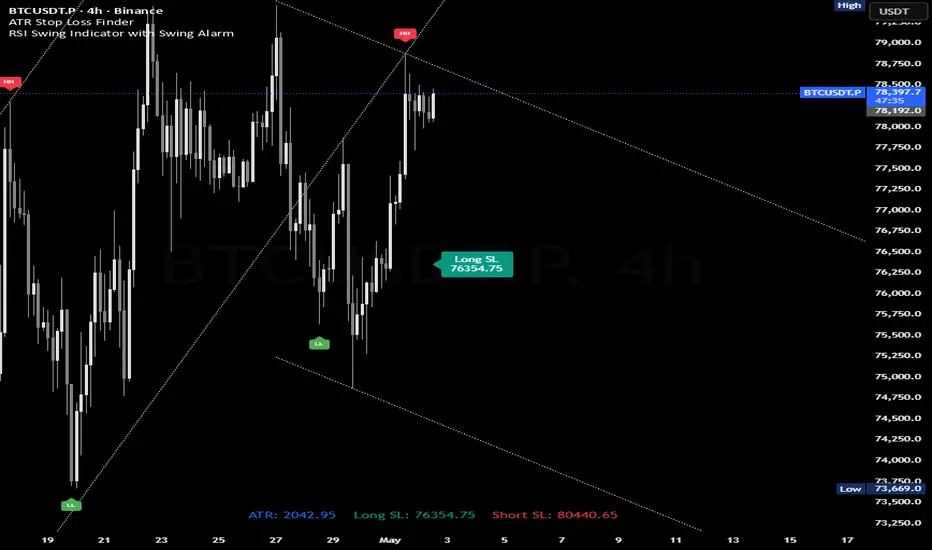
This indicator visualizes market structure using RSI-based swing detection.
It automatically identifies swing highs and lows based on overbought and oversold conditions and classifies them into:
HH (Higher High)
LH (Lower High)
HL (Higher Low)
LL (Lower Low)
How it works
The script uses the RSI to detect momentum extremes:
When RSI reaches the overbought zone, a swing high is formed
When RSI reaches the oversold zone, a swing low is formed
As long as RSI remains in these zones, the swing continues to update dynamically with price.
Once the opposite zone is reached, a new swing is confirmed and the structure is evaluated.
Key Features
Automatic detection of market structure (HH, LH, HL, LL)
Dynamic swing tracking while RSI remains in extreme zones
Optional swing lines connecting highs and lows
Clean chart visualization with minimal noise
Fully configurable RSI settings
Alerts
Built-in alert conditions for:
HH (Higher High)
LH (Lower High)
HL (Higher Low)
LL (Lower Low)
Any new swing event
This allows you to react instantly to structure changes in the market.
Best Use Cases
Trend confirmation and structure analysis
Identifying continuation vs. reversal setups
Combining with EMA, volume, or orderflow strategies
Intraday and swing trading
Tips
Use higher timeframes (e.g. 1H, 4H) for more reliable structure
Combine with trend filters (like EMA 50/100/200) for higher probability setups
Avoid using in low volatility or ranging markets without confirmation
It automatically identifies swing highs and lows based on overbought and oversold conditions and classifies them into:
HH (Higher High)
LH (Lower High)
HL (Higher Low)
LL (Lower Low)
How it works
The script uses the RSI to detect momentum extremes:
When RSI reaches the overbought zone, a swing high is formed
When RSI reaches the oversold zone, a swing low is formed
As long as RSI remains in these zones, the swing continues to update dynamically with price.
Once the opposite zone is reached, a new swing is confirmed and the structure is evaluated.
Key Features
Automatic detection of market structure (HH, LH, HL, LL)
Dynamic swing tracking while RSI remains in extreme zones
Optional swing lines connecting highs and lows
Clean chart visualization with minimal noise
Fully configurable RSI settings
Alerts
Built-in alert conditions for:
HH (Higher High)
LH (Lower High)
HL (Higher Low)
LL (Lower Low)
Any new swing event
This allows you to react instantly to structure changes in the market.
Best Use Cases
Trend confirmation and structure analysis
Identifying continuation vs. reversal setups
Combining with EMA, volume, or orderflow strategies
Intraday and swing trading
Tips
Use higher timeframes (e.g. 1H, 4H) for more reliable structure
Combine with trend filters (like EMA 50/100/200) for higher probability setups
Avoid using in low volatility or ranging markets without confirmation
开源脚本
秉承TradingView的精神,该脚本的作者将其开源,以便交易者可以查看和验证其功能。向作者致敬!您可以免费使用该脚本,但请记住,重新发布代码须遵守我们的网站规则。

免责声明
这些信息和出版物并非旨在提供,也不构成TradingView提供或认可的任何形式的财务、投资、交易或其他类型的建议或推荐。请阅读使用条款了解更多信息。
免责声明
这些信息和出版物并非旨在提供,也不构成TradingView提供或认可的任何形式的财务、投资、交易或其他类型的建议或推荐。请阅读使用条款了解更多信息。