OPEN-SOURCE SCRIPT
Advanced Market Structure & Glowing Wave Pro
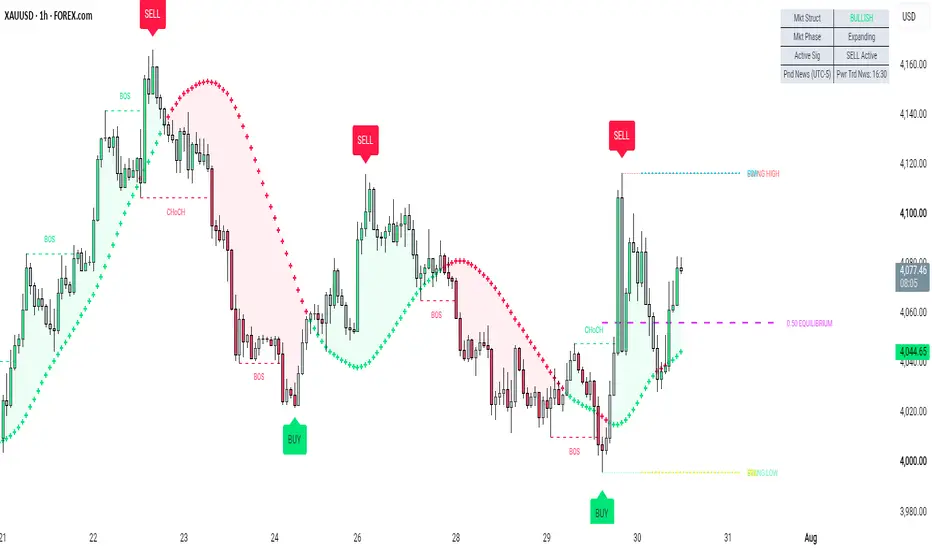
indicator description and usage guide
overview
advanced market structure and glowing wave pro is an all in one technical analysis script designed to help traders identify key market structures, major pivot reversal zones, dynamic trend momentum, and key daily levels on pine script v6.
this tool combines several essential trading concepts into a single clean visual experience, including smart money concepts market structure, dynamic momentum wave fills, high probability consolidation detection, daily high low tracking, and equilibrium levels.
key features explained
market structure tracking bos and choch
the script automatically detects pivot highs and lows to plot break of structure bos and change of character choch lines. green dashed lines represent bullish structure breaks, while red dashed lines represent bearish structure breaks. this helps traders analyze market direction without cluttering the chart.
major swing buy and sell signals
signals are calculated based on major structural pivots to reduce noise and avoid false breakouts. buy tags appear near key structural swing lows, and sell tags appear near key structural swing highs. these signals act as visual alerts for potential trend reversals or continuation setups.
glowing wave line with dynamic background fill
the wave line uses a hull moving average engine to plot smooth trend direction. the background space between the wave line and price close fills dynamically with a semi-transparent green or red glow, allowing you to instantly visualize trend strength and price expansion without obscuring your price candles.
dynamic consolidation and high probability zones
using average true range calculations, the indicator detects tight consolidation phases where price compresses. during these phases, candle colors shift to neutral grey tones and a high probability zone box highlights potential breakout ranges.
previous day high and low pdh pdl
key institutional levels like the previous day high and previous day low are automatically drawn on the chart. once price breaks through a daily level, the corresponding line auto disappears to keep your workspace clean.
0.50 fibonacci equilibrium line
a stylized mid point equilibrium line is plotted based on the recent range. this acts as a quick reference for premium and discount price zones.
customizable info dashboard
an elegant on screen panel displays current market structure status, market phase expansion or consolidation, active signal state, and pending session news times.
how to use this indicator
step 1 identifying overall trend direction
check the direction and color of the glowing wave line along with the info panel market structure reading. green indicates bullish momentum, while red indicates bearish momentum.
step 2 monitoring structure breaks
look for choch signals for early signs of a trend shift, or bos signals for trend continuation confirmation.
step 3 waiting for major swing signals
watch for major buy or sell tags printed near major swing highs and lows. ensure the signal aligns with the broader market context and your personal trading strategy.
step 4 tracking daily key levels
use the pdh and pdl lines as potential liquidity target areas or bounce zones during intra day sessions.
Things to avoid
do not treat buy and sell signals as automated financial advice or direct entry triggers. always use proper risk management.
do not trade signals blindly during high impact economic news events or inside tight consolidation ranges.
do not rely solely on one indicator. integrate this tool into a comprehensive trading system that includes risk management and independent analysis.
house rules compliance and risk disclaimer
disclaimer
this script is created strictly for educational, informational, and chart analysis purposes only. it does not constitute financial, investment, or trading advice. past performance indicated by visual cues or structural breaks on historical data does not guarantee future results. trading foreign exchange, commodities, stocks, and crypto assets carries a high level of risk, and you may lose more than your initial investment. always conduct your own research and consult a licensed financial advisor before making trading decisions.
author note
if you find this tool helpful for your technical analysis, feel free to like the script, leave your feedback in the comments, and follow for future updates and tools.
overview
advanced market structure and glowing wave pro is an all in one technical analysis script designed to help traders identify key market structures, major pivot reversal zones, dynamic trend momentum, and key daily levels on pine script v6.
this tool combines several essential trading concepts into a single clean visual experience, including smart money concepts market structure, dynamic momentum wave fills, high probability consolidation detection, daily high low tracking, and equilibrium levels.
key features explained
market structure tracking bos and choch
the script automatically detects pivot highs and lows to plot break of structure bos and change of character choch lines. green dashed lines represent bullish structure breaks, while red dashed lines represent bearish structure breaks. this helps traders analyze market direction without cluttering the chart.
major swing buy and sell signals
signals are calculated based on major structural pivots to reduce noise and avoid false breakouts. buy tags appear near key structural swing lows, and sell tags appear near key structural swing highs. these signals act as visual alerts for potential trend reversals or continuation setups.
glowing wave line with dynamic background fill
the wave line uses a hull moving average engine to plot smooth trend direction. the background space between the wave line and price close fills dynamically with a semi-transparent green or red glow, allowing you to instantly visualize trend strength and price expansion without obscuring your price candles.
dynamic consolidation and high probability zones
using average true range calculations, the indicator detects tight consolidation phases where price compresses. during these phases, candle colors shift to neutral grey tones and a high probability zone box highlights potential breakout ranges.
previous day high and low pdh pdl
key institutional levels like the previous day high and previous day low are automatically drawn on the chart. once price breaks through a daily level, the corresponding line auto disappears to keep your workspace clean.
0.50 fibonacci equilibrium line
a stylized mid point equilibrium line is plotted based on the recent range. this acts as a quick reference for premium and discount price zones.
customizable info dashboard
an elegant on screen panel displays current market structure status, market phase expansion or consolidation, active signal state, and pending session news times.
how to use this indicator
step 1 identifying overall trend direction
check the direction and color of the glowing wave line along with the info panel market structure reading. green indicates bullish momentum, while red indicates bearish momentum.
step 2 monitoring structure breaks
look for choch signals for early signs of a trend shift, or bos signals for trend continuation confirmation.
step 3 waiting for major swing signals
watch for major buy or sell tags printed near major swing highs and lows. ensure the signal aligns with the broader market context and your personal trading strategy.
step 4 tracking daily key levels
use the pdh and pdl lines as potential liquidity target areas or bounce zones during intra day sessions.
Things to avoid
do not treat buy and sell signals as automated financial advice or direct entry triggers. always use proper risk management.
do not trade signals blindly during high impact economic news events or inside tight consolidation ranges.
do not rely solely on one indicator. integrate this tool into a comprehensive trading system that includes risk management and independent analysis.
house rules compliance and risk disclaimer
disclaimer
this script is created strictly for educational, informational, and chart analysis purposes only. it does not constitute financial, investment, or trading advice. past performance indicated by visual cues or structural breaks on historical data does not guarantee future results. trading foreign exchange, commodities, stocks, and crypto assets carries a high level of risk, and you may lose more than your initial investment. always conduct your own research and consult a licensed financial advisor before making trading decisions.
author note
if you find this tool helpful for your technical analysis, feel free to like the script, leave your feedback in the comments, and follow for future updates and tools.
开源脚本
秉承TradingView的精神,该脚本的作者将其开源,以便交易者可以查看和验证其功能。向作者致敬!您可以免费使用该脚本,但请记住,重新发布代码须遵守我们的网站规则。

免责声明
这些信息和出版物并非旨在提供,也不构成TradingView提供或认可的任何形式的财务、投资、交易或其他类型的建议或推荐。请阅读使用条款了解更多信息。
开源脚本
秉承TradingView的精神,该脚本的作者将其开源,以便交易者可以查看和验证其功能。向作者致敬!您可以免费使用该脚本,但请记住,重新发布代码须遵守我们的网站规则。
免责声明
这些信息和出版物并非旨在提供,也不构成TradingView提供或认可的任何形式的财务、投资、交易或其他类型的建议或推荐。请阅读使用条款了解更多信息。