Session Killzones ICT - Clean
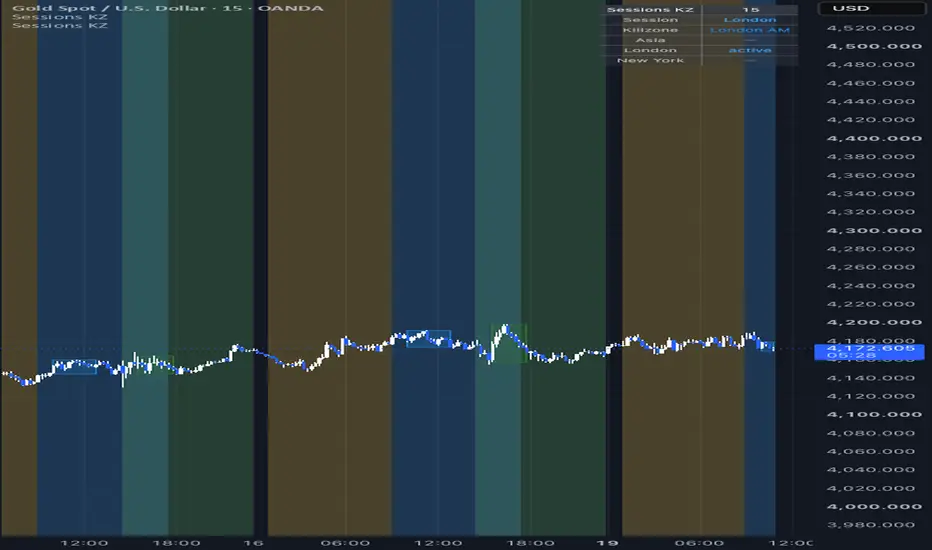
A clean, no-frills visualisation of the three main trading sessions (Asia / London / New York) and the two most actionable ICT killzones (London AM, NY AM), with a compact dashboard that tells you exactly where you are in the trading day.
WHAT IT DOES
• Shades the chart background by session (Asia, London, New York) with distinct semi-transparent colours, so every bar is instantly readable in its session context.
• Highlights the two ICT killzones most traders reference — London AM (10:00–13:00 Paris) and NY AM (15:30–18:00 Paris) — and draws an auto-updating box tracking each killzone's high and low.
• Small top-right dashboard: current session, current killzone, active/inactive status of each session.
• Five alerts: one per session open, one per killzone open.
WHY SESSION CONTEXT MATTERS
Liquidity, volatility and directional behaviour change materially across Asia, London and New York. The two killzones are the windows most intraday traders plan around — and, in our own Gold data, clocks rather than edges: sweeps inside them reversed by end of day no more often than elsewhere (London AM 44%, NY AM 49%). Having this drawn automatically, in your own timezone and DST-aware, removes mental overhead and keeps you from trading the wrong hour of the wrong session.
HOW TO USE
1. Add to any intraday chart (works on any liquid instrument — Gold, indices, FX, crypto).
2. Set your timezone (default Europe/Paris). All windows are DST-aware.
3. Keep the default session and killzone windows, or adjust them to your routine.
4. Read the dashboard before acting; use the Asia high/low as early-London liquidity references; treat the London-close / NY-open gap as a low-quality window.
5. Enable the alerts if you want a notification at each session or killzone open.
SETTINGS
Timezone · Asia 01:00–09:00 · London 09:00–17:30 · New York 14:30–23:00 · London AM 10:00–13:00 · NY AM 15:30–18:00 · killzone range boxes on/off · dashboard position and size.
NOTES
Pure context tool — no signals, no repainting (everything is computed from bar timestamps and completed bars). Pine Script v6, compiles with zero warnings.
No indicator is infallible. Context first — decisions remain yours.
WHAT IT DOES
• Shades the chart background by session (Asia, London, New York) with distinct semi-transparent colours, so every bar is instantly readable in its session context.
• Highlights the two ICT killzones most traders reference — London AM (10:00–13:00 Paris) and NY AM (15:30–18:00 Paris) — and draws an auto-updating box tracking each killzone's high and low.
• Small top-right dashboard: current session, current killzone, active/inactive status of each session.
• Five alerts: one per session open, one per killzone open.
WHY SESSION CONTEXT MATTERS
Liquidity, volatility and directional behaviour change materially across Asia, London and New York. The two killzones are the windows most intraday traders plan around — and, in our own Gold data, clocks rather than edges: sweeps inside them reversed by end of day no more often than elsewhere (London AM 44%, NY AM 49%). Having this drawn automatically, in your own timezone and DST-aware, removes mental overhead and keeps you from trading the wrong hour of the wrong session.
HOW TO USE
1. Add to any intraday chart (works on any liquid instrument — Gold, indices, FX, crypto).
2. Set your timezone (default Europe/Paris). All windows are DST-aware.
3. Keep the default session and killzone windows, or adjust them to your routine.
4. Read the dashboard before acting; use the Asia high/low as early-London liquidity references; treat the London-close / NY-open gap as a low-quality window.
5. Enable the alerts if you want a notification at each session or killzone open.
SETTINGS
Timezone · Asia 01:00–09:00 · London 09:00–17:30 · New York 14:30–23:00 · London AM 10:00–13:00 · NY AM 15:30–18:00 · killzone range boxes on/off · dashboard position and size.
NOTES
Pure context tool — no signals, no repainting (everything is computed from bar timestamps and completed bars). Pine Script v6, compiles with zero warnings.
No indicator is infallible. Context first — decisions remain yours.

Measured, not assumed. Full studies with sample sizes and confidence intervals: deltaterminal.io/research
免责声明
这些信息和出版物并非旨在提供,也不构成TradingView提供或认可的任何形式的财务、投资、交易或其他类型的建议或推荐。请阅读使用条款了解更多信息。
Measured, not assumed. Full studies with sample sizes and confidence intervals: deltaterminal.io/research
免责声明
这些信息和出版物并非旨在提供,也不构成TradingView提供或认可的任何形式的财务、投资、交易或其他类型的建议或推荐。请阅读使用条款了解更多信息。